Crafting and managing a cryptocurrency hedge fund equipped with an all-encompassing robo-advisory trading system is an intricate venture, harmonising financial acumen with the prowess of artificial intelligence.
With nearly two years of operation under our belt, our cryptocurrency hedge fund showcases our experience in the field. Our portfolio features two funds, the "Signature Fund" and the "Deep-Alpha Fund, " designed to cater to different investor needs and market conditions.
The "Signature Fund" is focused on low-risk strategies, emphasising Bitcoin (BTC). Its goal is to achieve a near-zero beta to reduce volatility and drawdown. Our main objective is to provide consistent returns, benchmarking against BTC's performance.
In contrast, the "Deep-Alpha Fund" takes on a higher risk, following a passive buy-and-hold approach. This fund aims to maintain a beta close to 1, hoping to benefit from bullish market trends. It uses Total2 (Altcoins) as its benchmark, offering investors exposure to alternative cryptocurrencies.
Both funds rely on our advanced quantitative algorithms, supported by current AI, and machine learning techniques. These algorithms process various data, including on-chain information, exchange metrics, and macroeconomic data. We carefully refine these data sources to monitor the cryptocurrency market closely, helping with thorough risk assessments and mitigation.
While our modus operandi echoes many peers in the hedge fund and asset management sphere, a defining hallmark sets us apart: our trust in artificial intelligence to helm tasks that traditionally challenge human capacities.
In our commitment to thorough validation, we compared our methodology to the benchmark of the S&P500, carefully removing features specific to Cryptocurrencies. Leveraging our expertise, we successfully refined our methodology to other key financial sectors, notably the stock market, using a decade's worth of data on the S&P 500. We've detailed these findings in the 'S&P 500 Multi-Transformers (Beta)' appendix.
These findings highlight the versatility of our approach across various financial sectors. To match the confidence level of our cryptocurrency models, a specialized team would require a minimum of six months of intensive research to develop a dependable version.
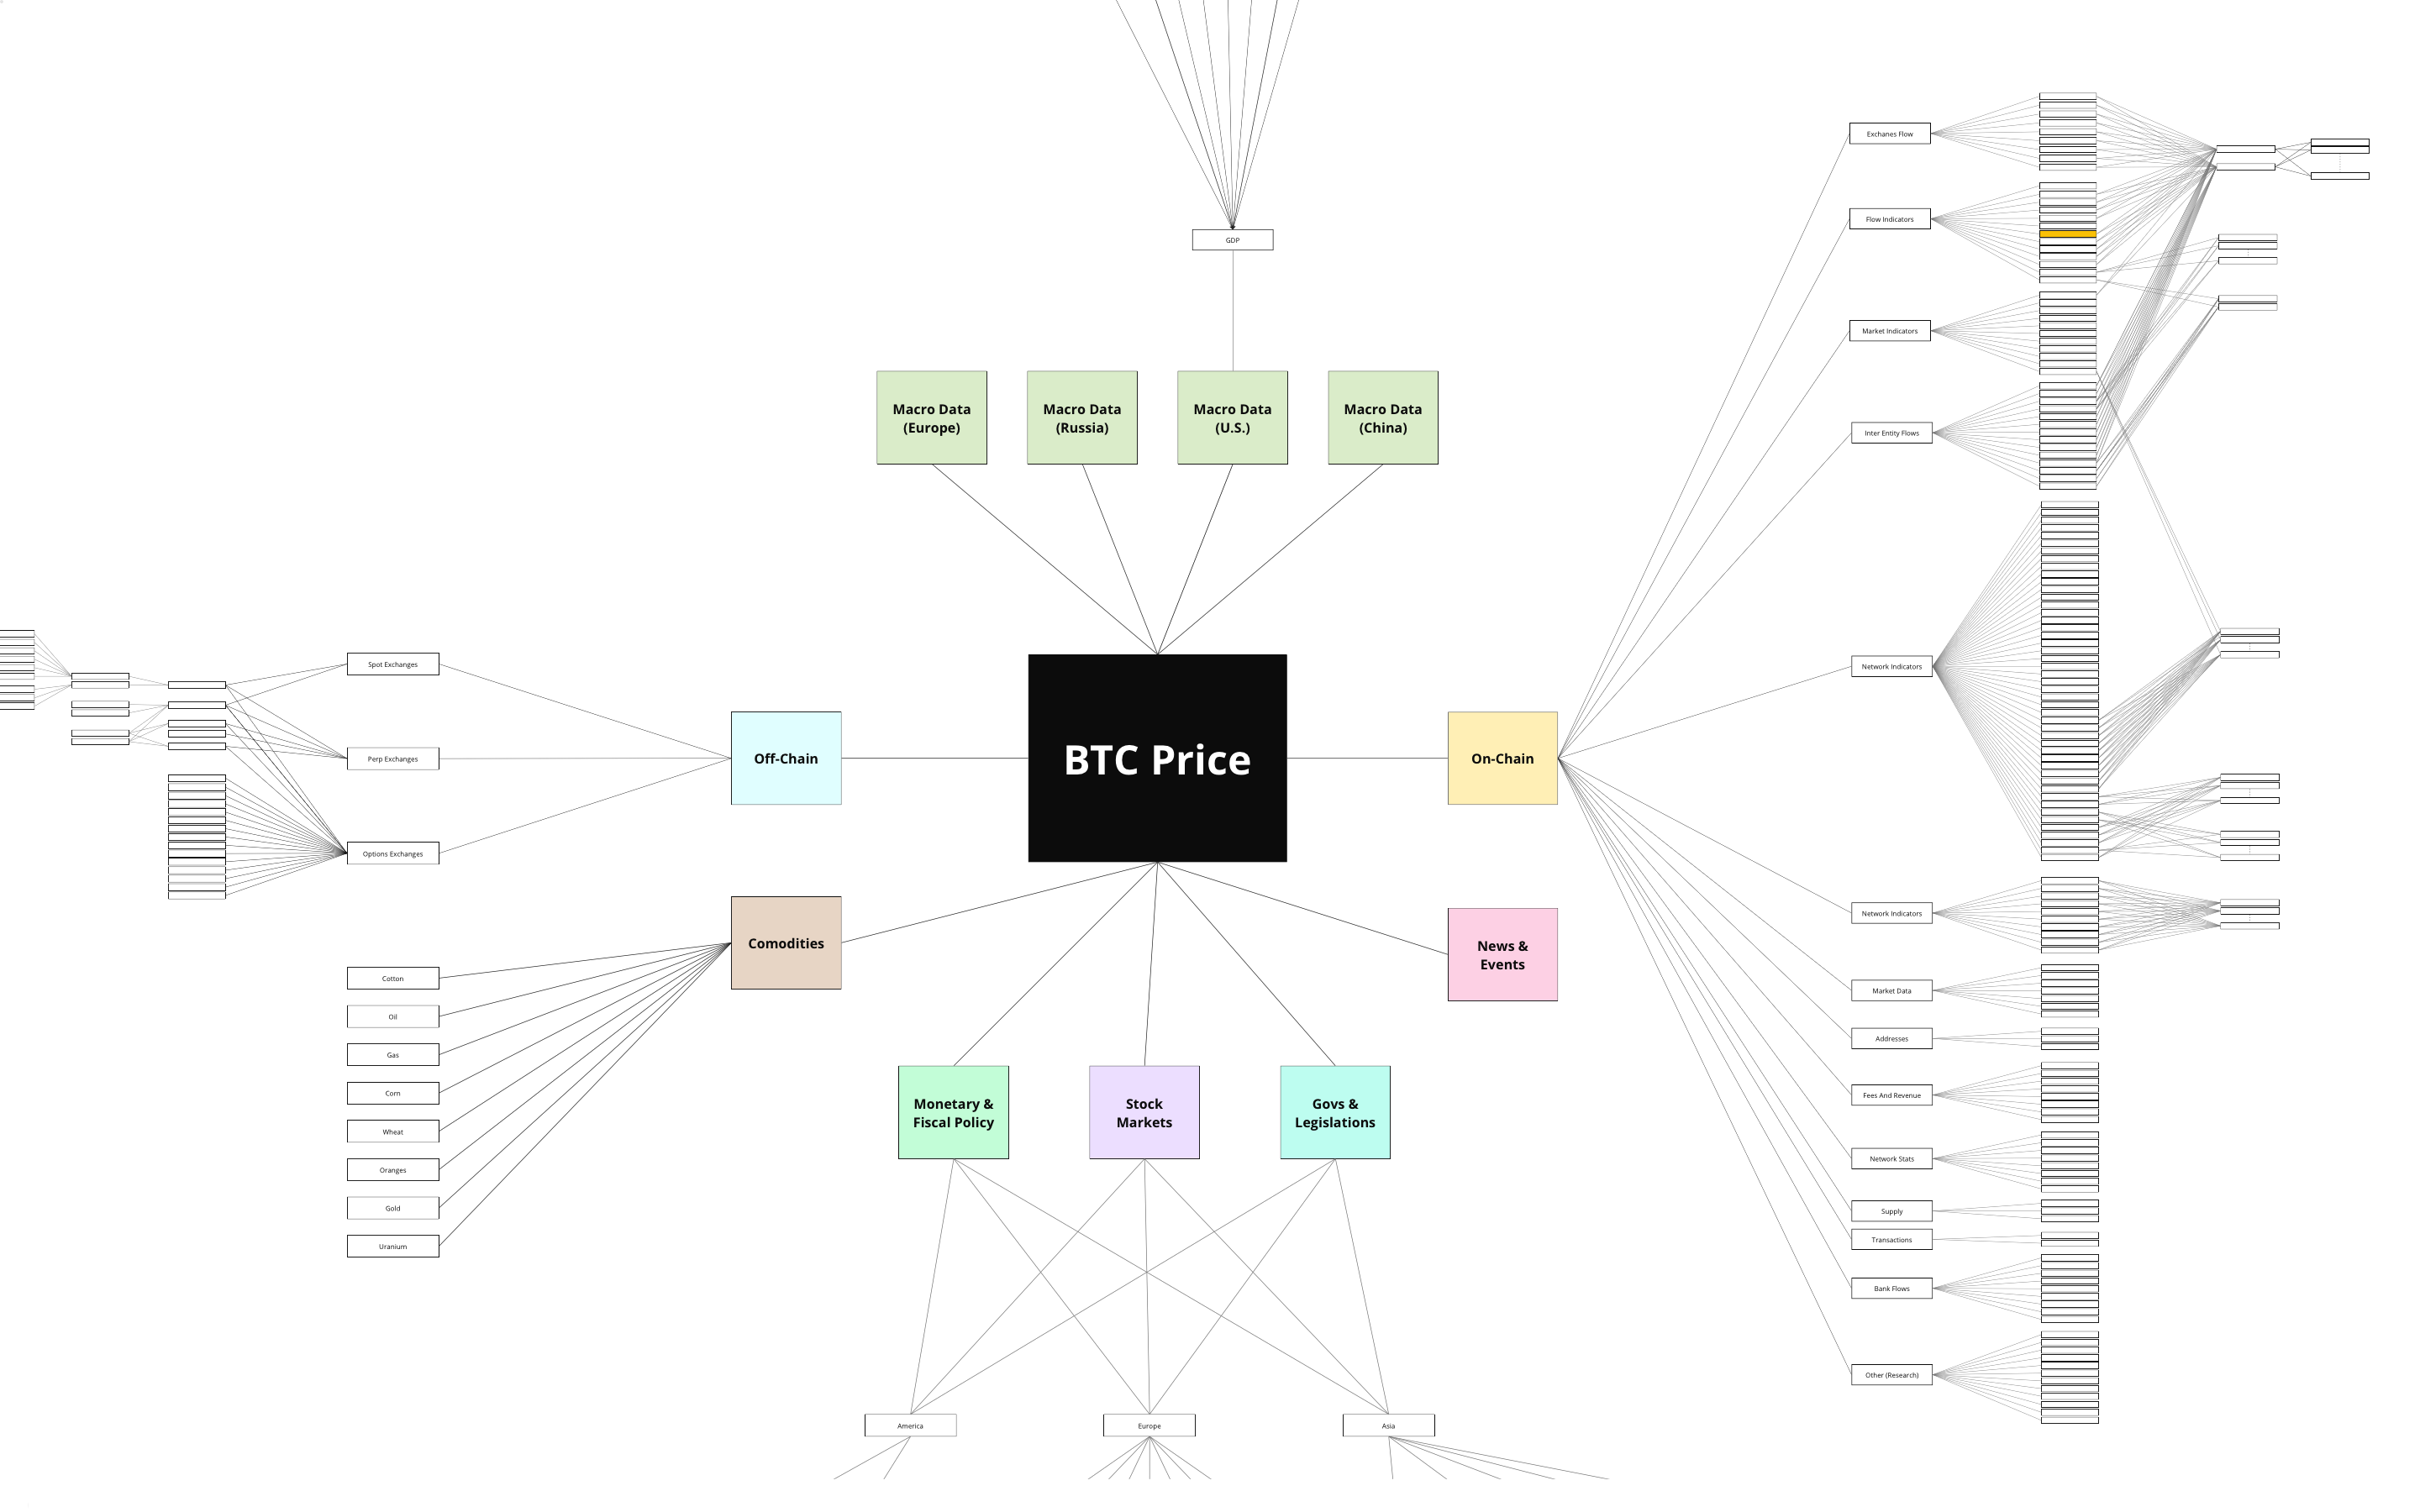
Let's look closer at our Signature Fund to understand its workings. Developing a complete robo-advisory trading system requires a solid grasp of the market. This means assessing risks, analyzing the behavior of major Bitcoin players, understanding crypto exchanges, and keeping track of key global economic factors and events.
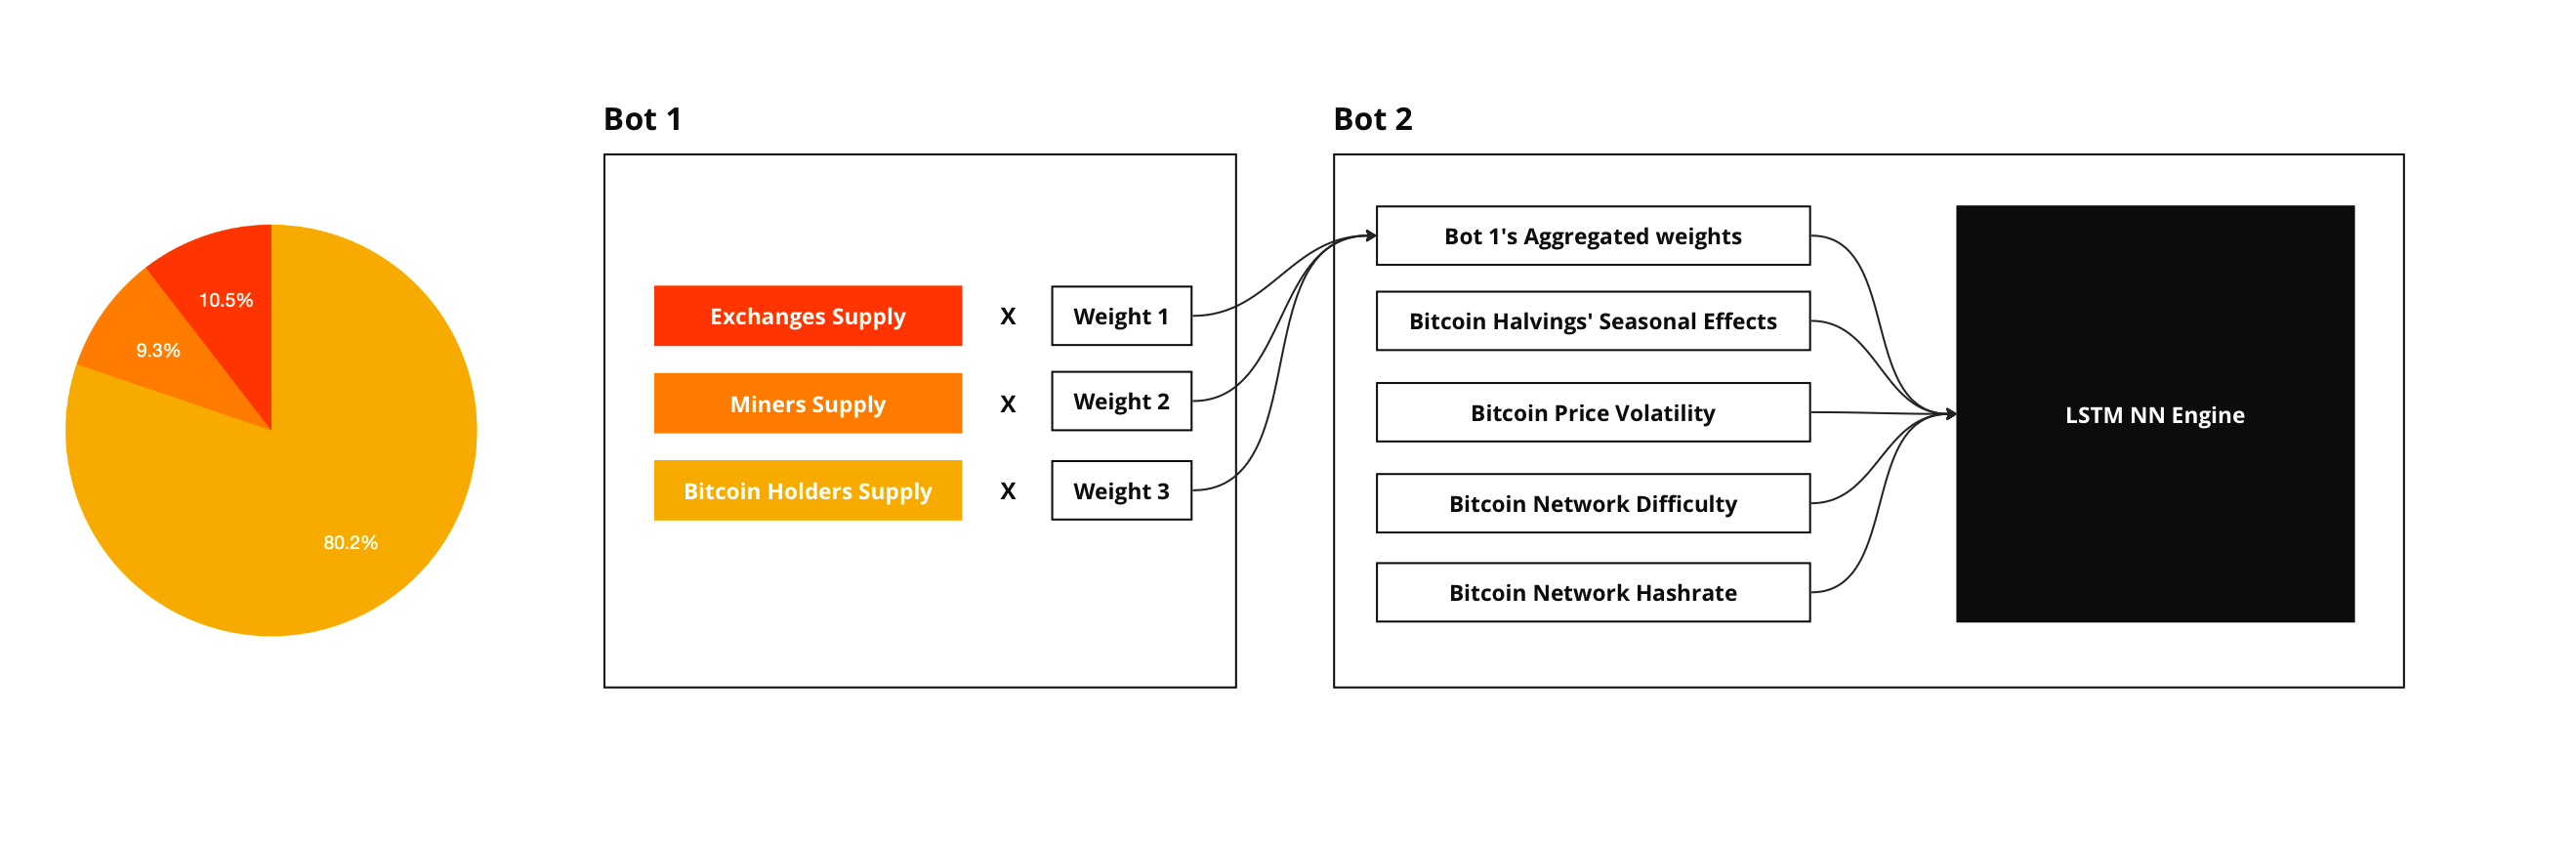
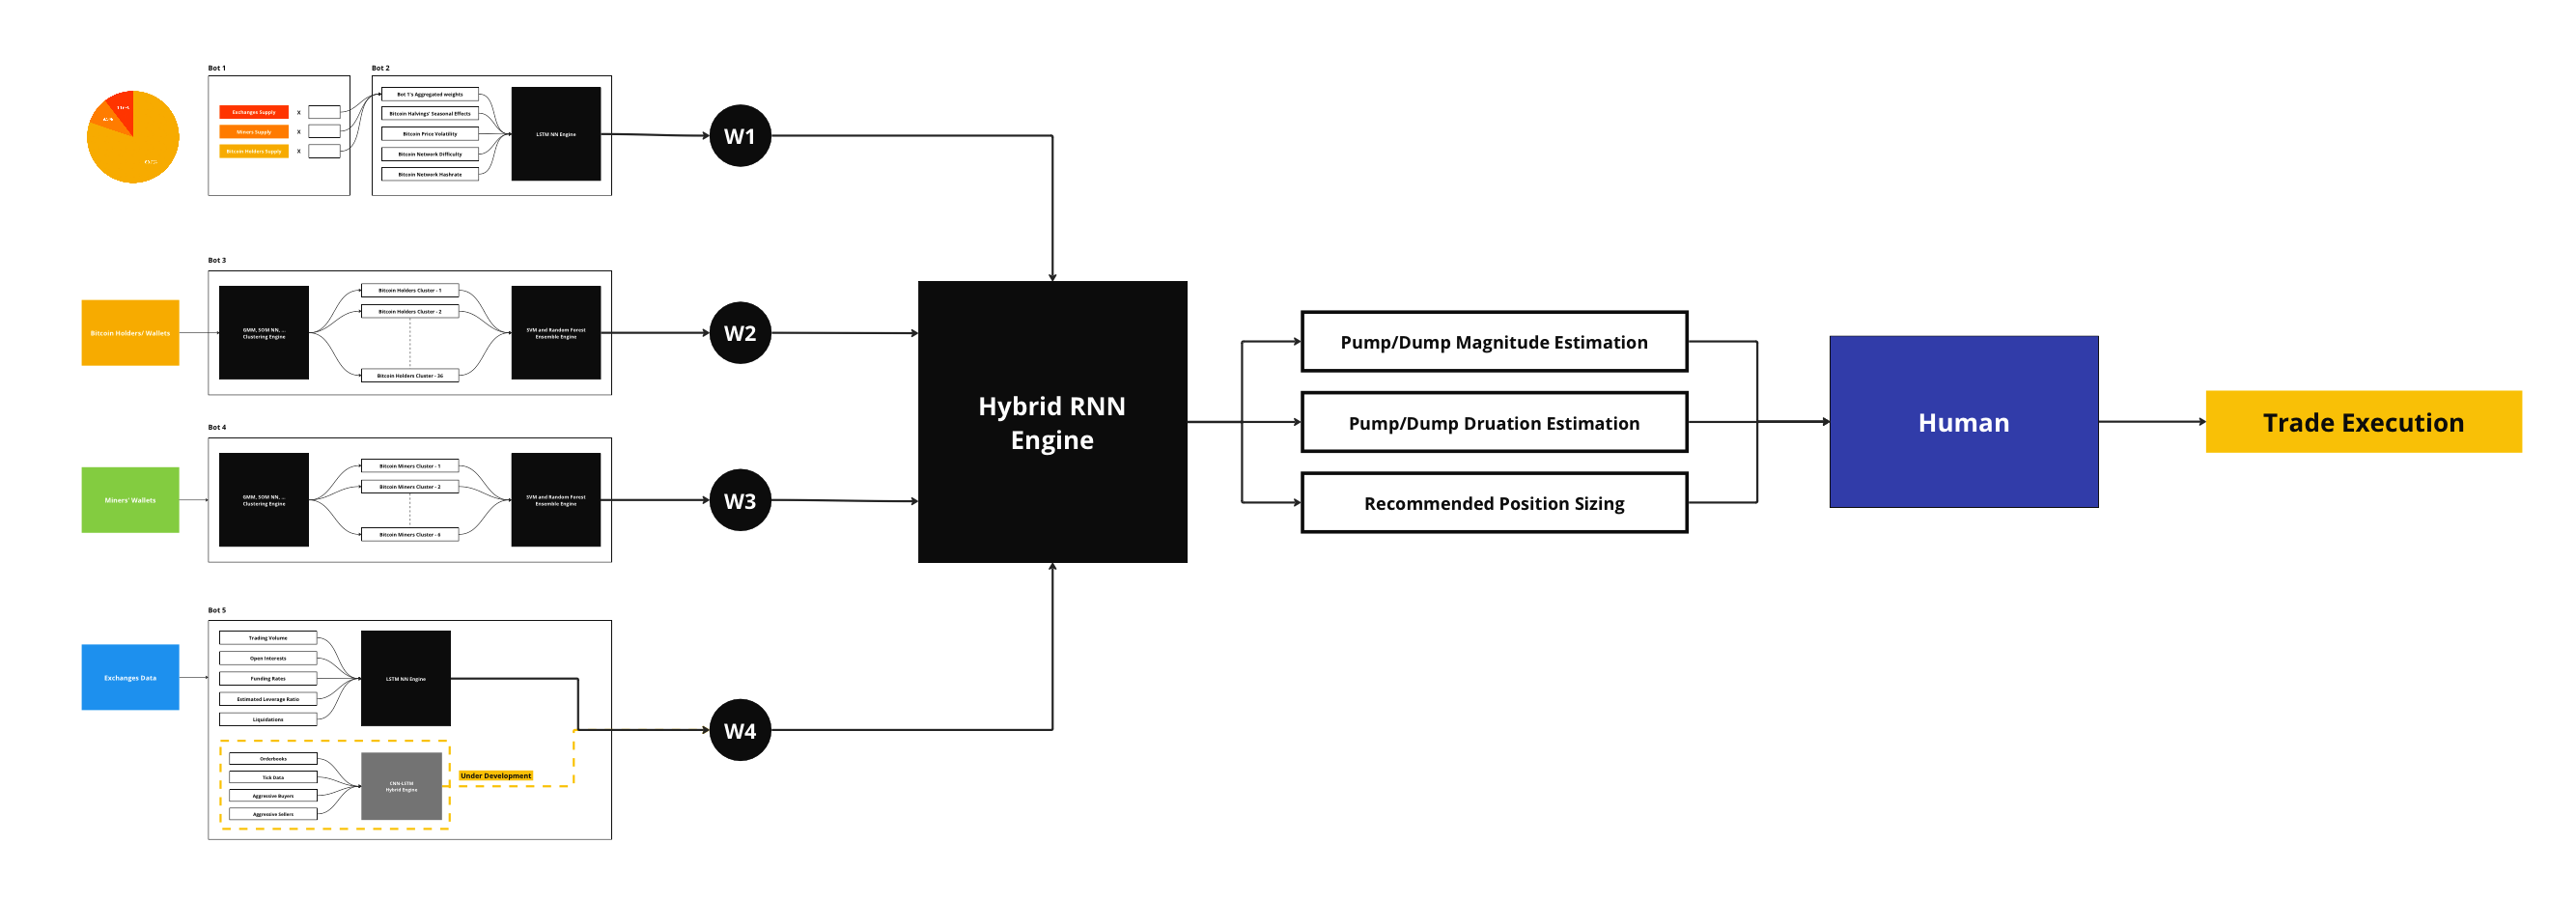
Bot1 measures the daily relative weight of Bitcoin holders (Exchanges, Miners, Whales) to Bitcoin’s total supply using a simple linear algorithm to calculate the selling power of each group and then passes it to Bot2.
Bot2 uses Bot1’s output as input alongside four other metrics (Historical Bitcoin price changes after each halving, historical price volatility, historical network’s hashrate and difficulty) to the Long Short Term Memory Neural Networks engine, which is responsible for capturing long-term dependencies between Bitcoin price data, it's fundamental events and estimating the level of reserved risk/reward based on Bitcoin’s historical cycles with supply-adjusted weights.
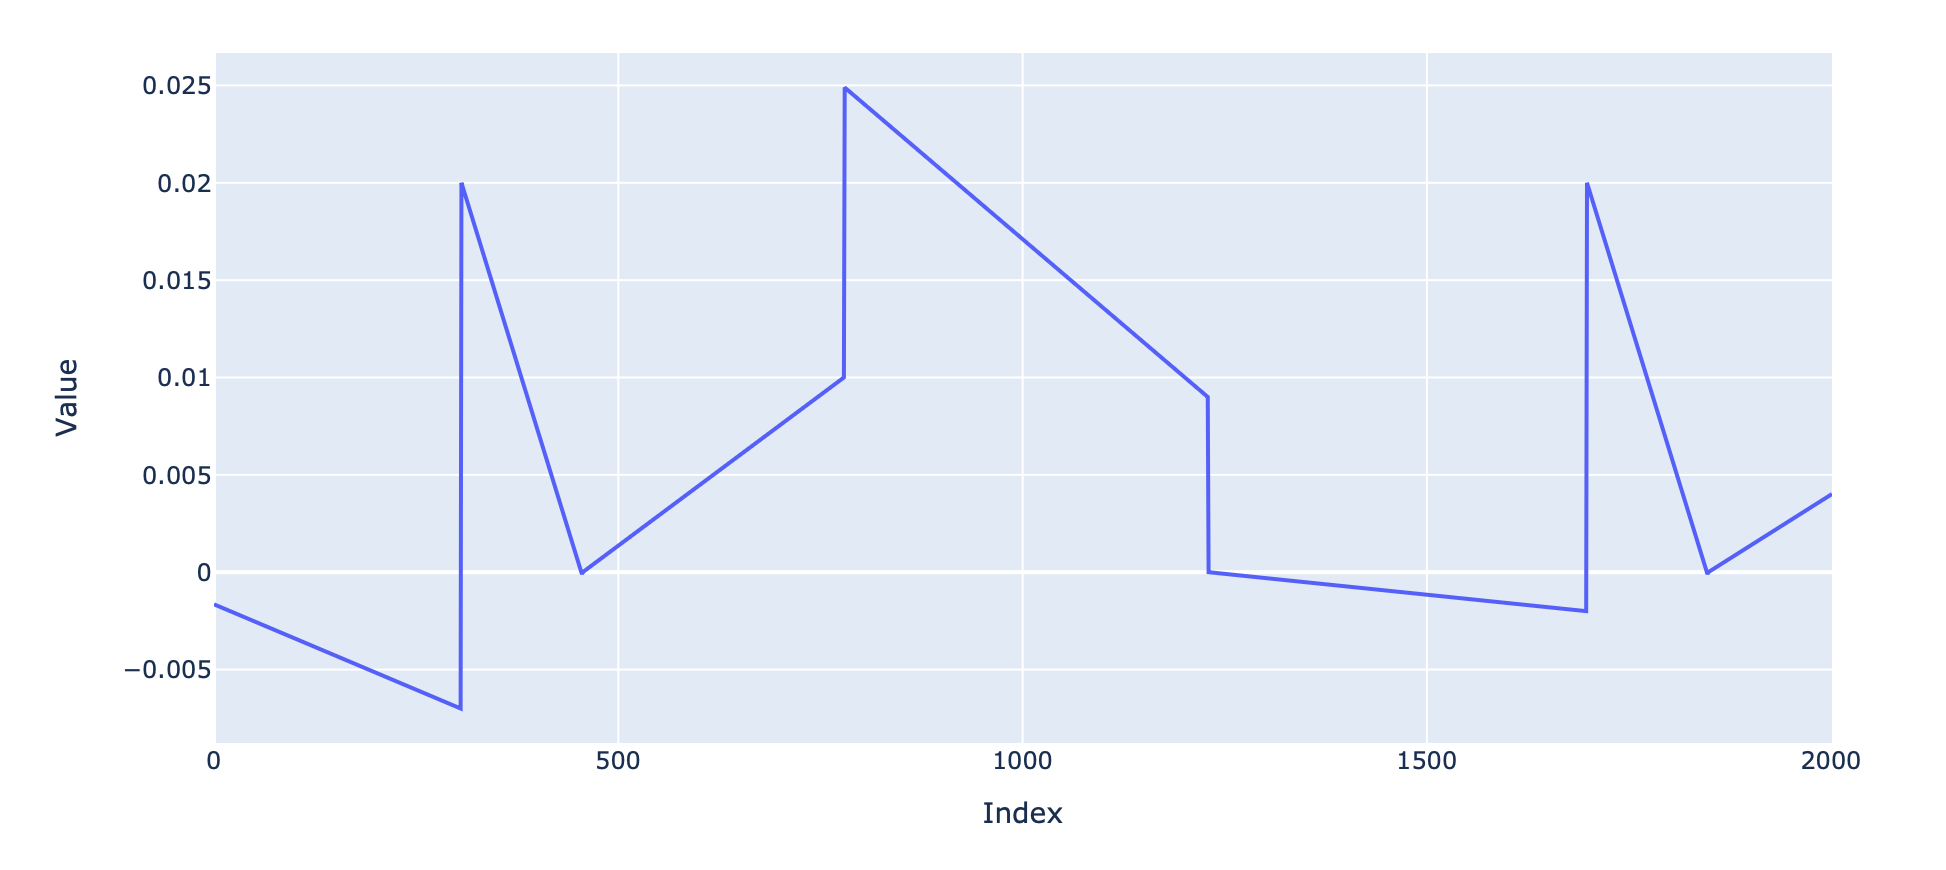
For instance, this is how Bot2 sees the last 2,000 days’ reserved risk of the market based on Bitcoin’s previous cycles:
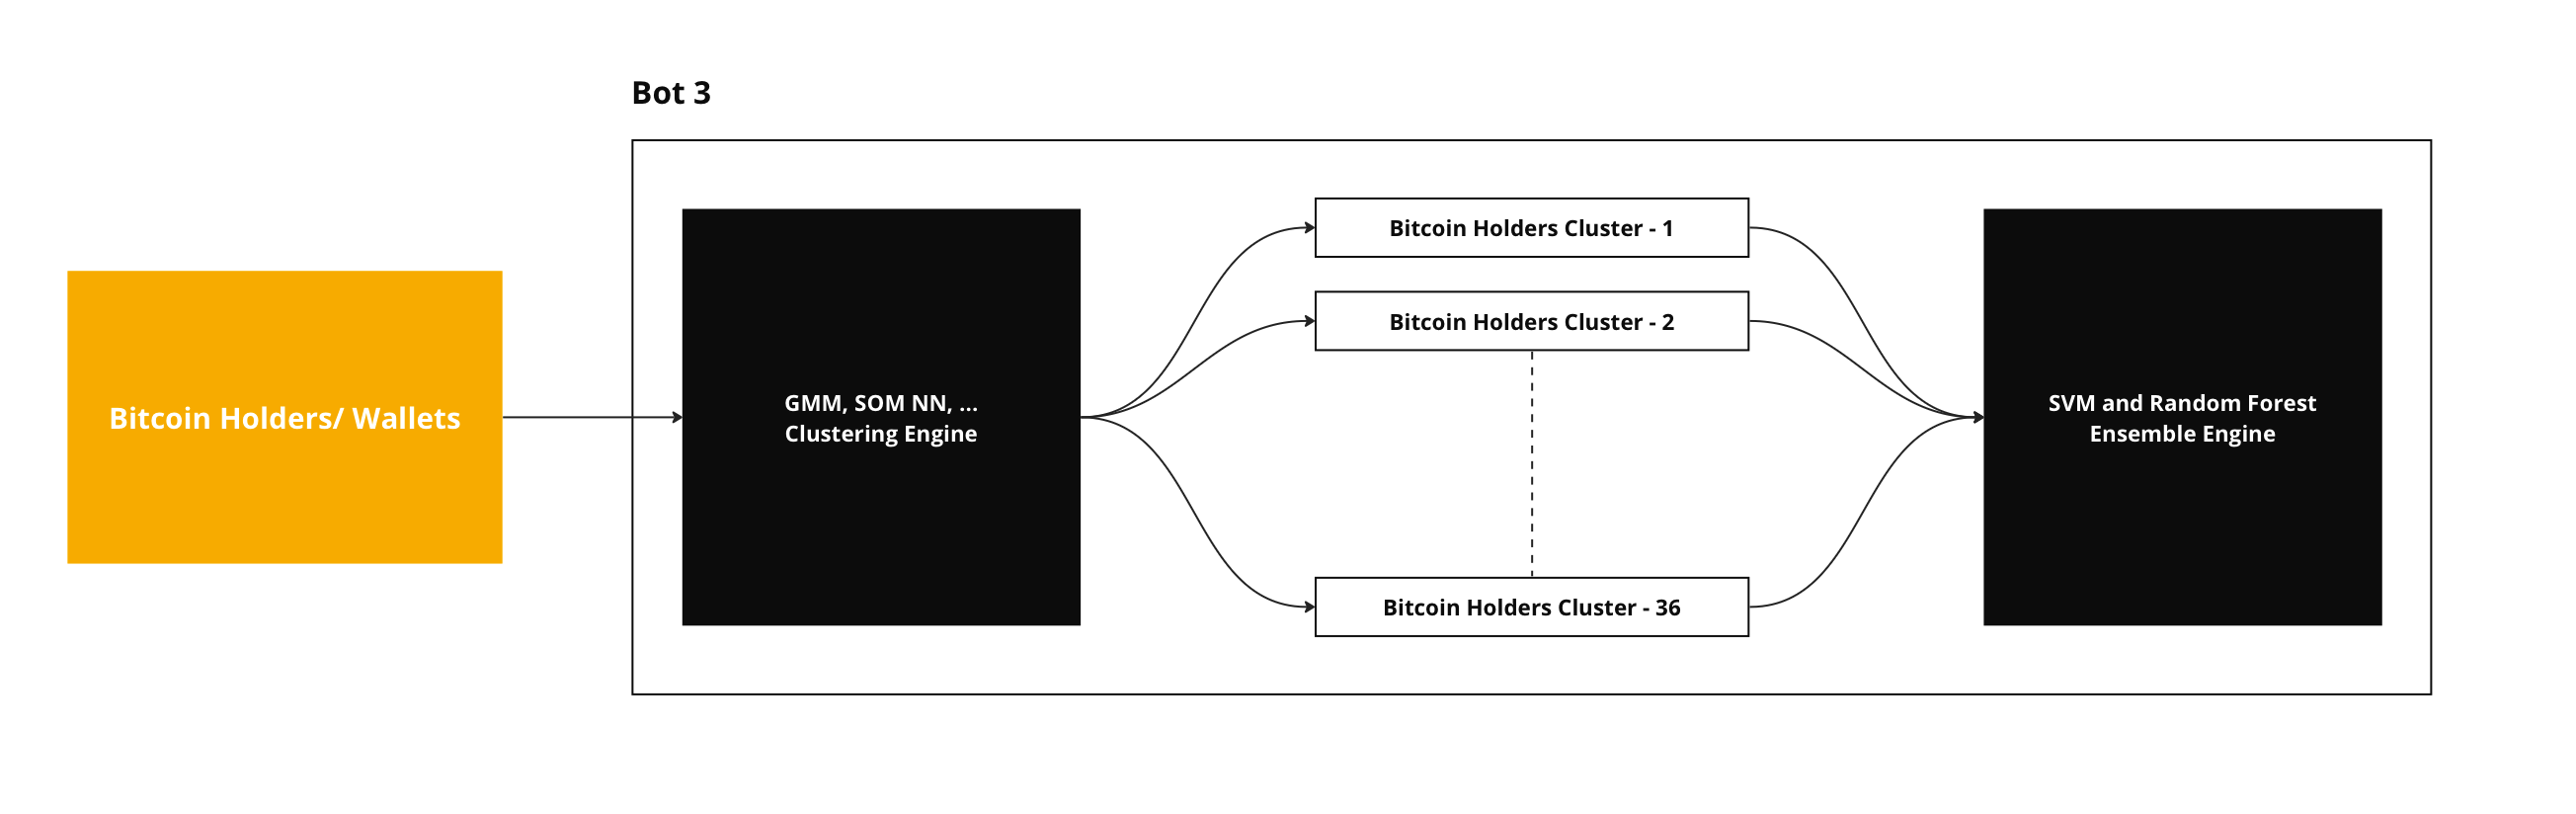
Inside Bot3, which works in parallel with Bot1 and Bot2, are two AI engines in series. The first one benefits from a Gaussian Mixture Model, Graph Neural Networks and other techniques to cluster the Bitcoin holder’s wallets into our 36 desired clusters based on each wallet’s historical data and transactions using billions of data points. Then, our Ensemble AI Engine will do the rest to measure the real-time risk magnitude each cluster is bringing to the market.
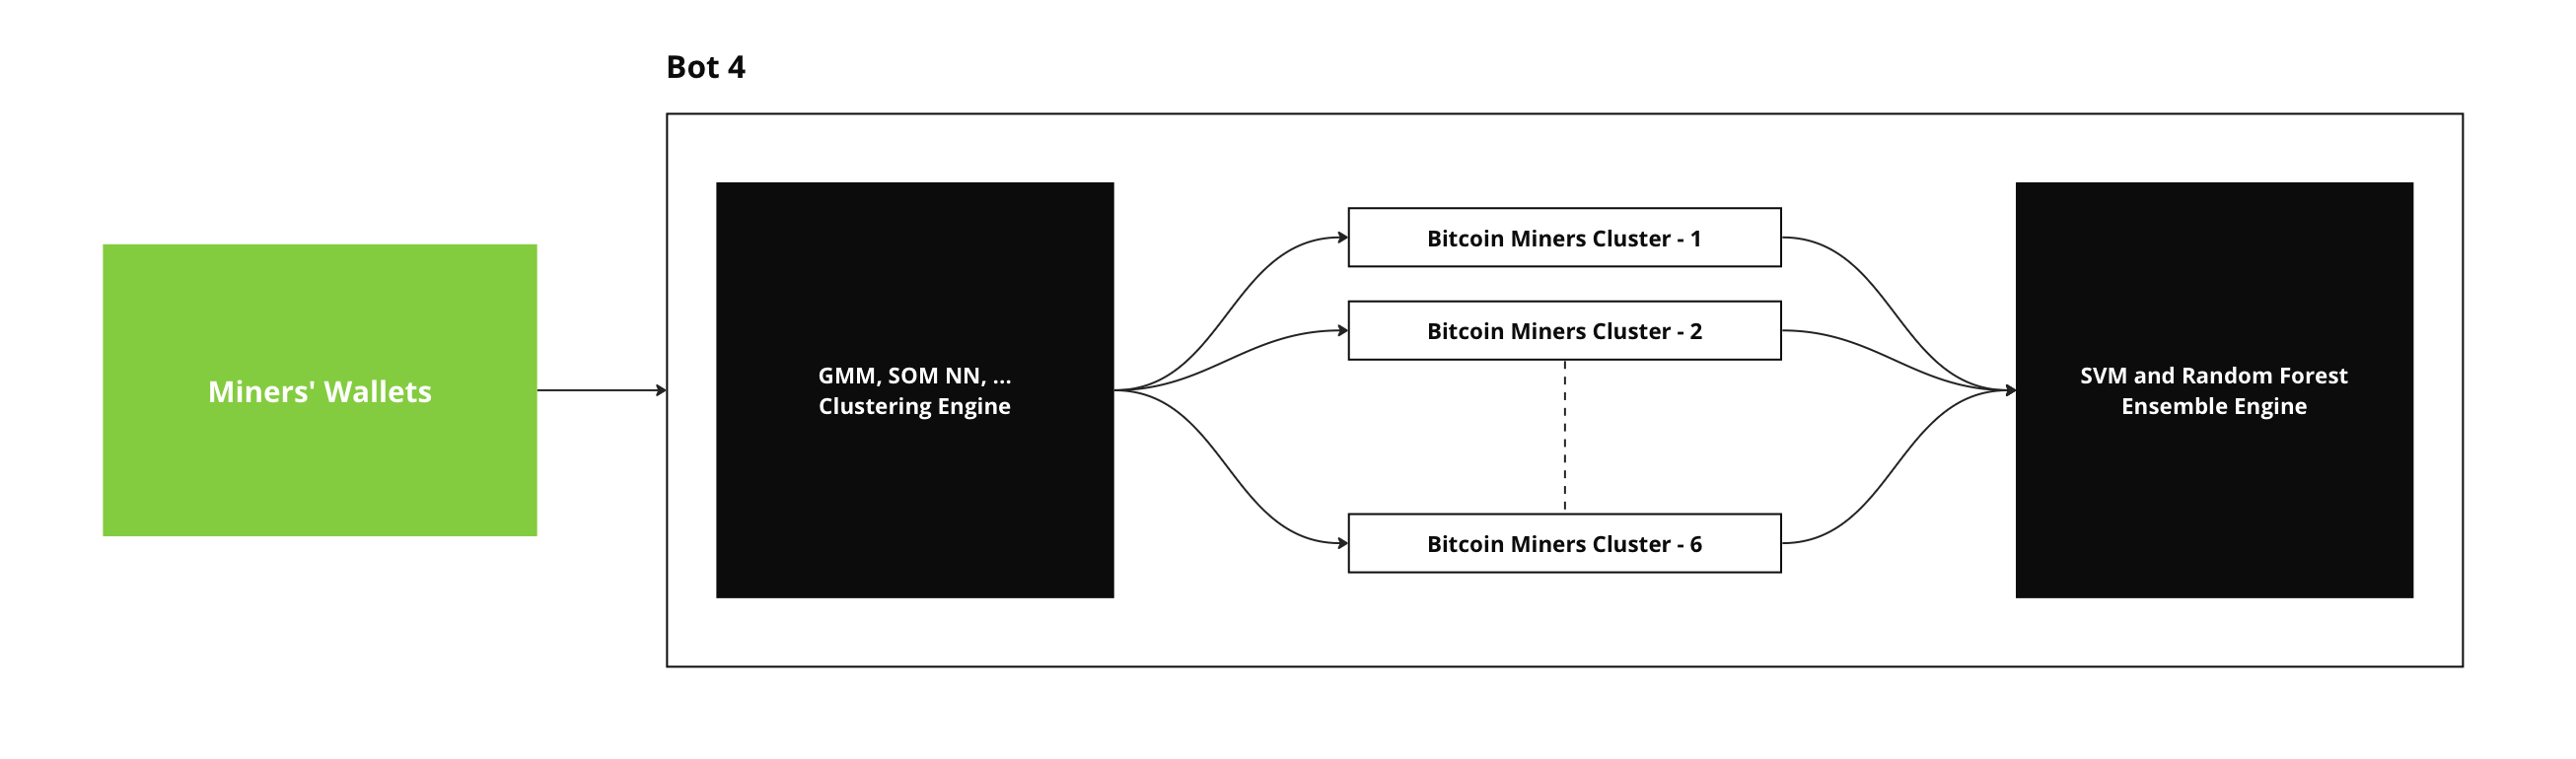
Bot4 operates in parallel with Bots 1, 2, and 3. However, all computation and clustering techniques focus on the Miners' Wallets data during this process. The objective is to measure the real-time risk magnitude for each of the six identified clusters within the mining sector and determine their impact on the market.
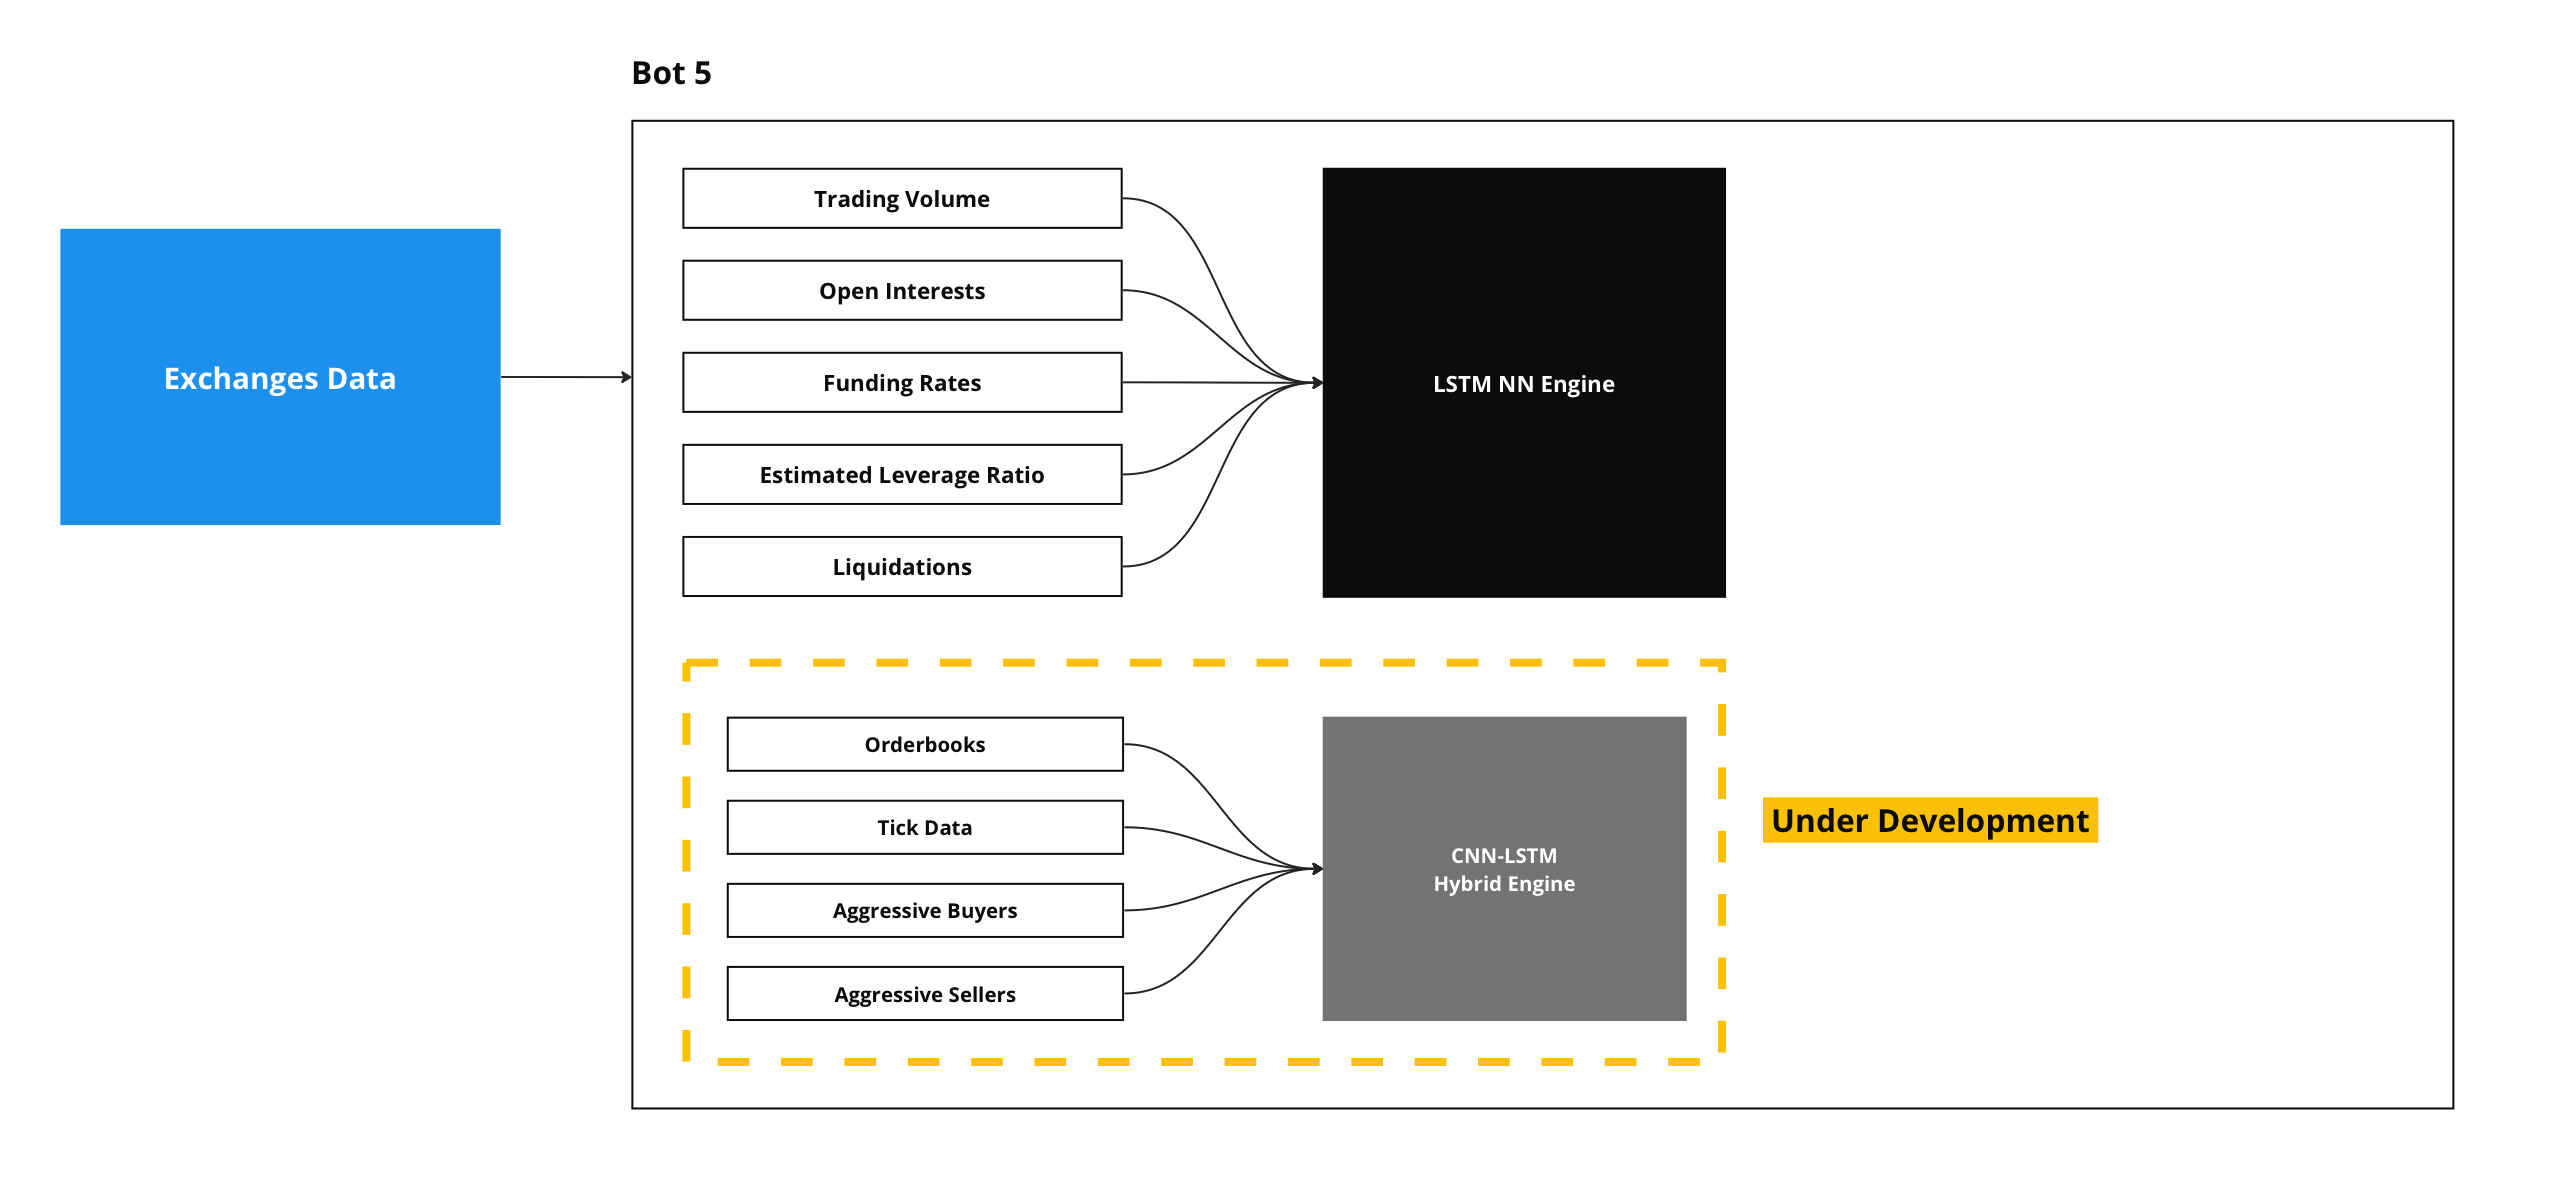
Similarly, Bot5 works in tandem with other bots, concentrating on evaluating the risk magnitude arising from exchanges. This emphasis is crucial, as crypto exchanges hold significant sway over price fluctuations.
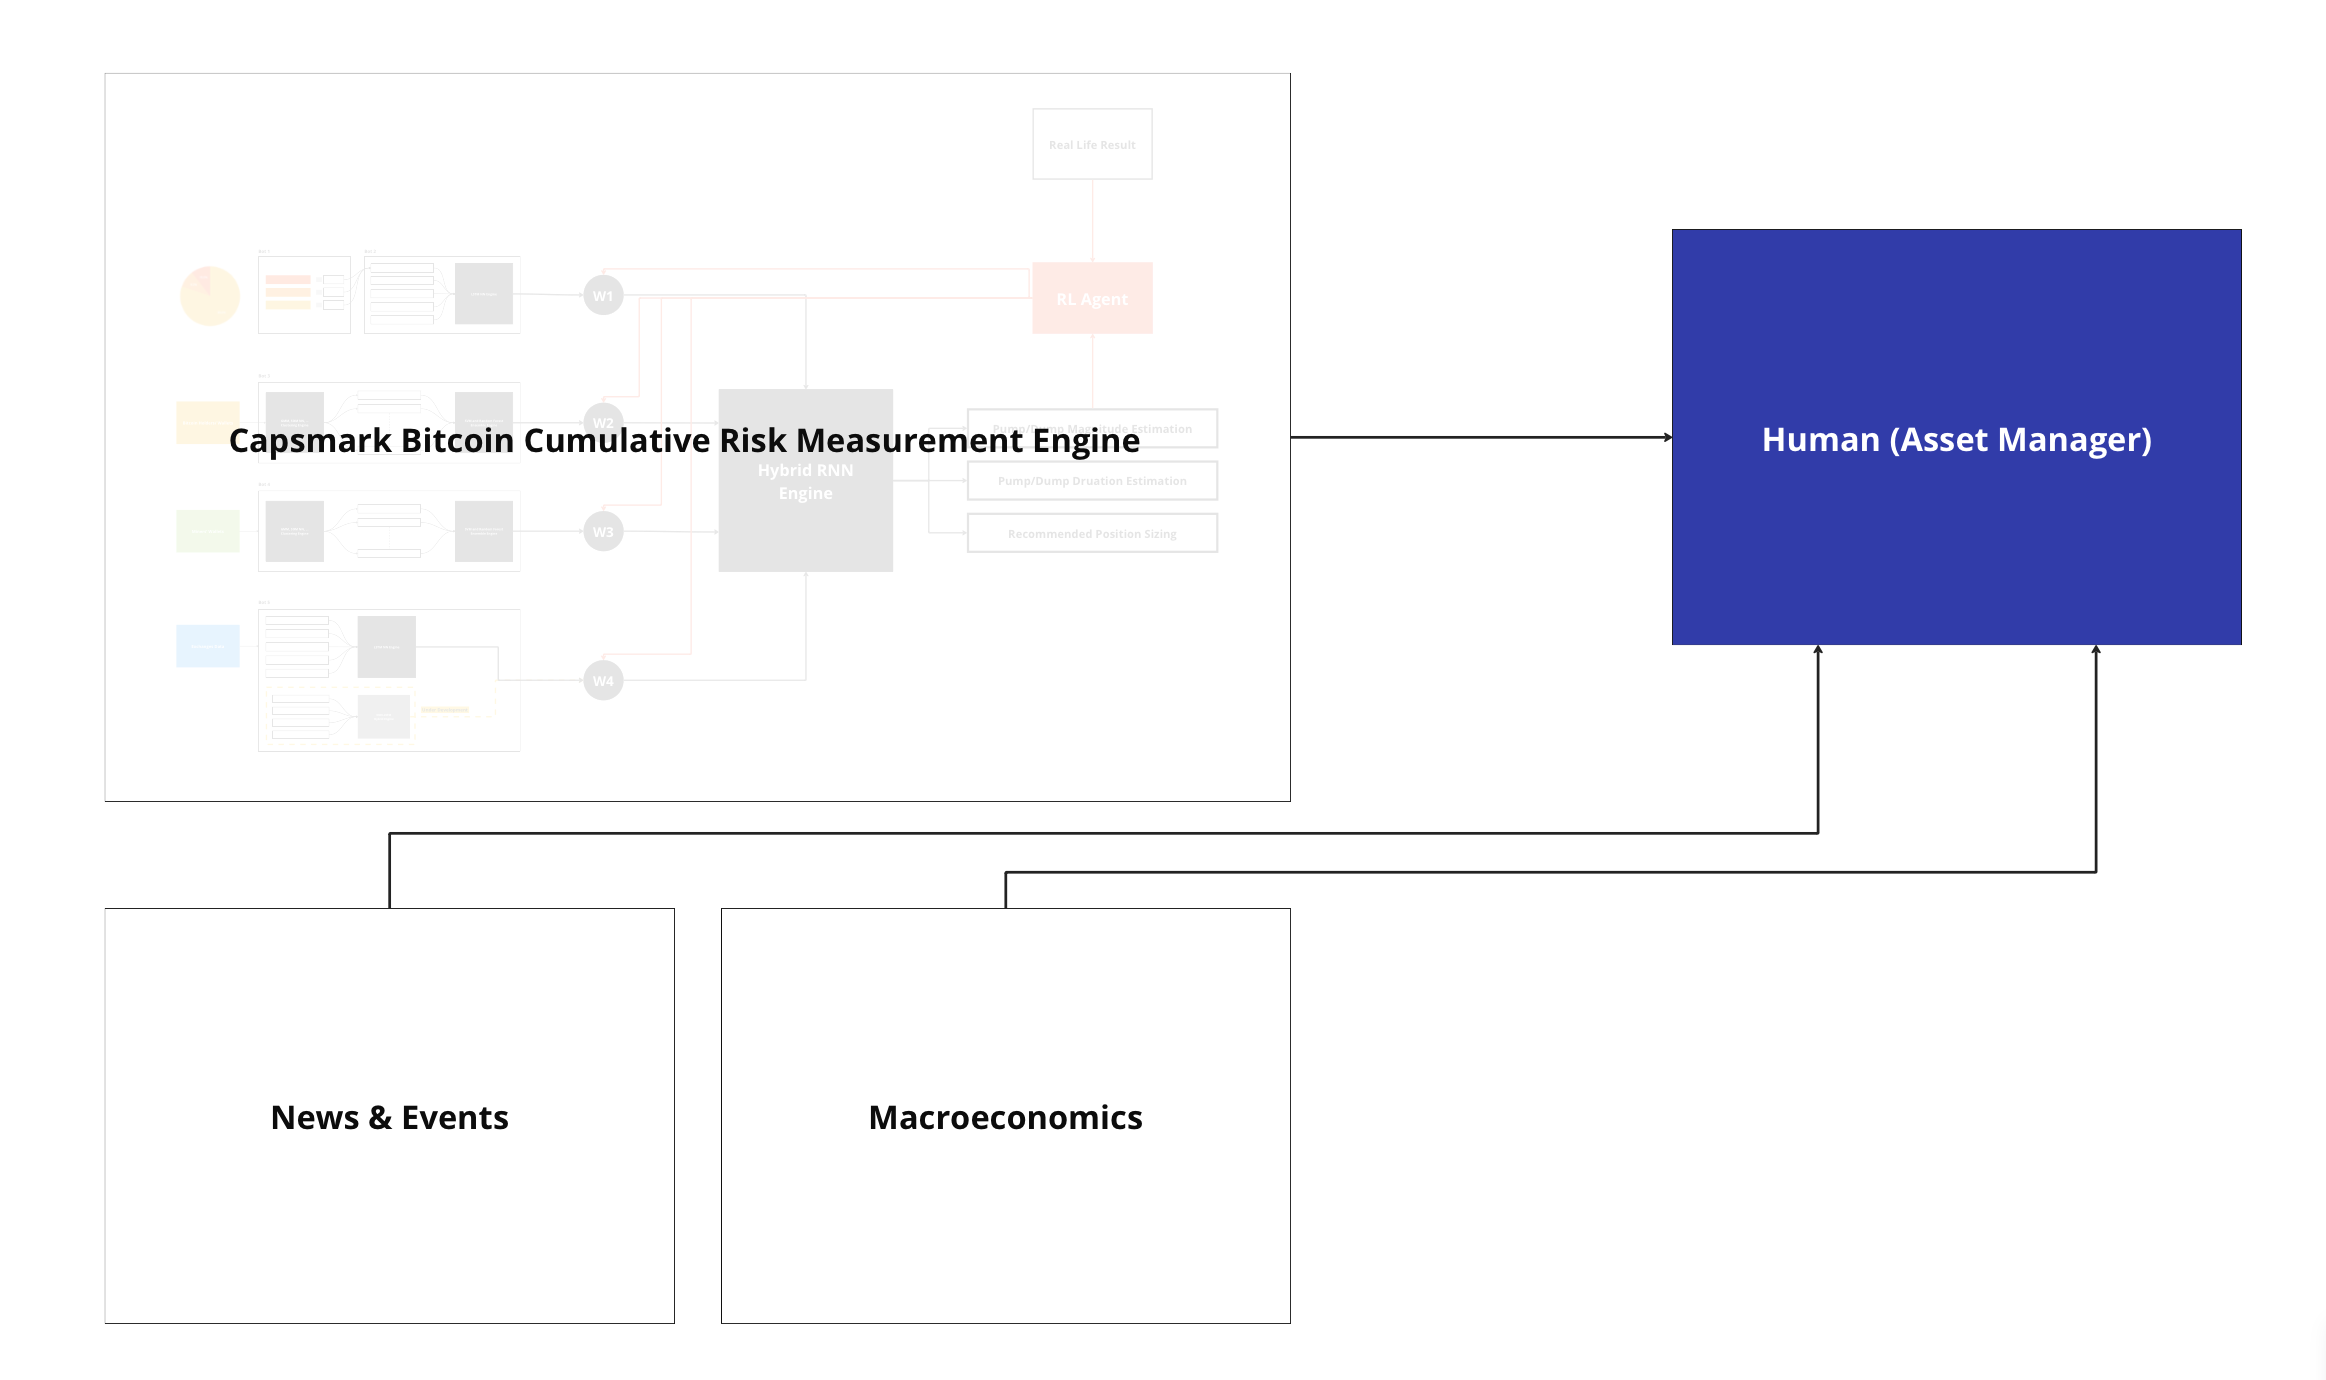
With the reserved risk from each sector now accurately gauged, our advanced Hybrid RNN Engine steps in. It aggregates these risks, factoring in the weight assigned to each industry. This weight determination comes from thoroughly examining the sector's historical data and performance. Specifically, the engine carries out three critical tasks:
The trio of recommendations, each paired with its occurrence probability, is relayed to a Trader or Asset Manager. This detailed insight equips the Asset Manager to effectively gauge and scrutinize the imminent reserved risk, especially those stemming from On-Chain activities and crypto exchanges, ensuring enhanced risk mitigation strategies are in place."
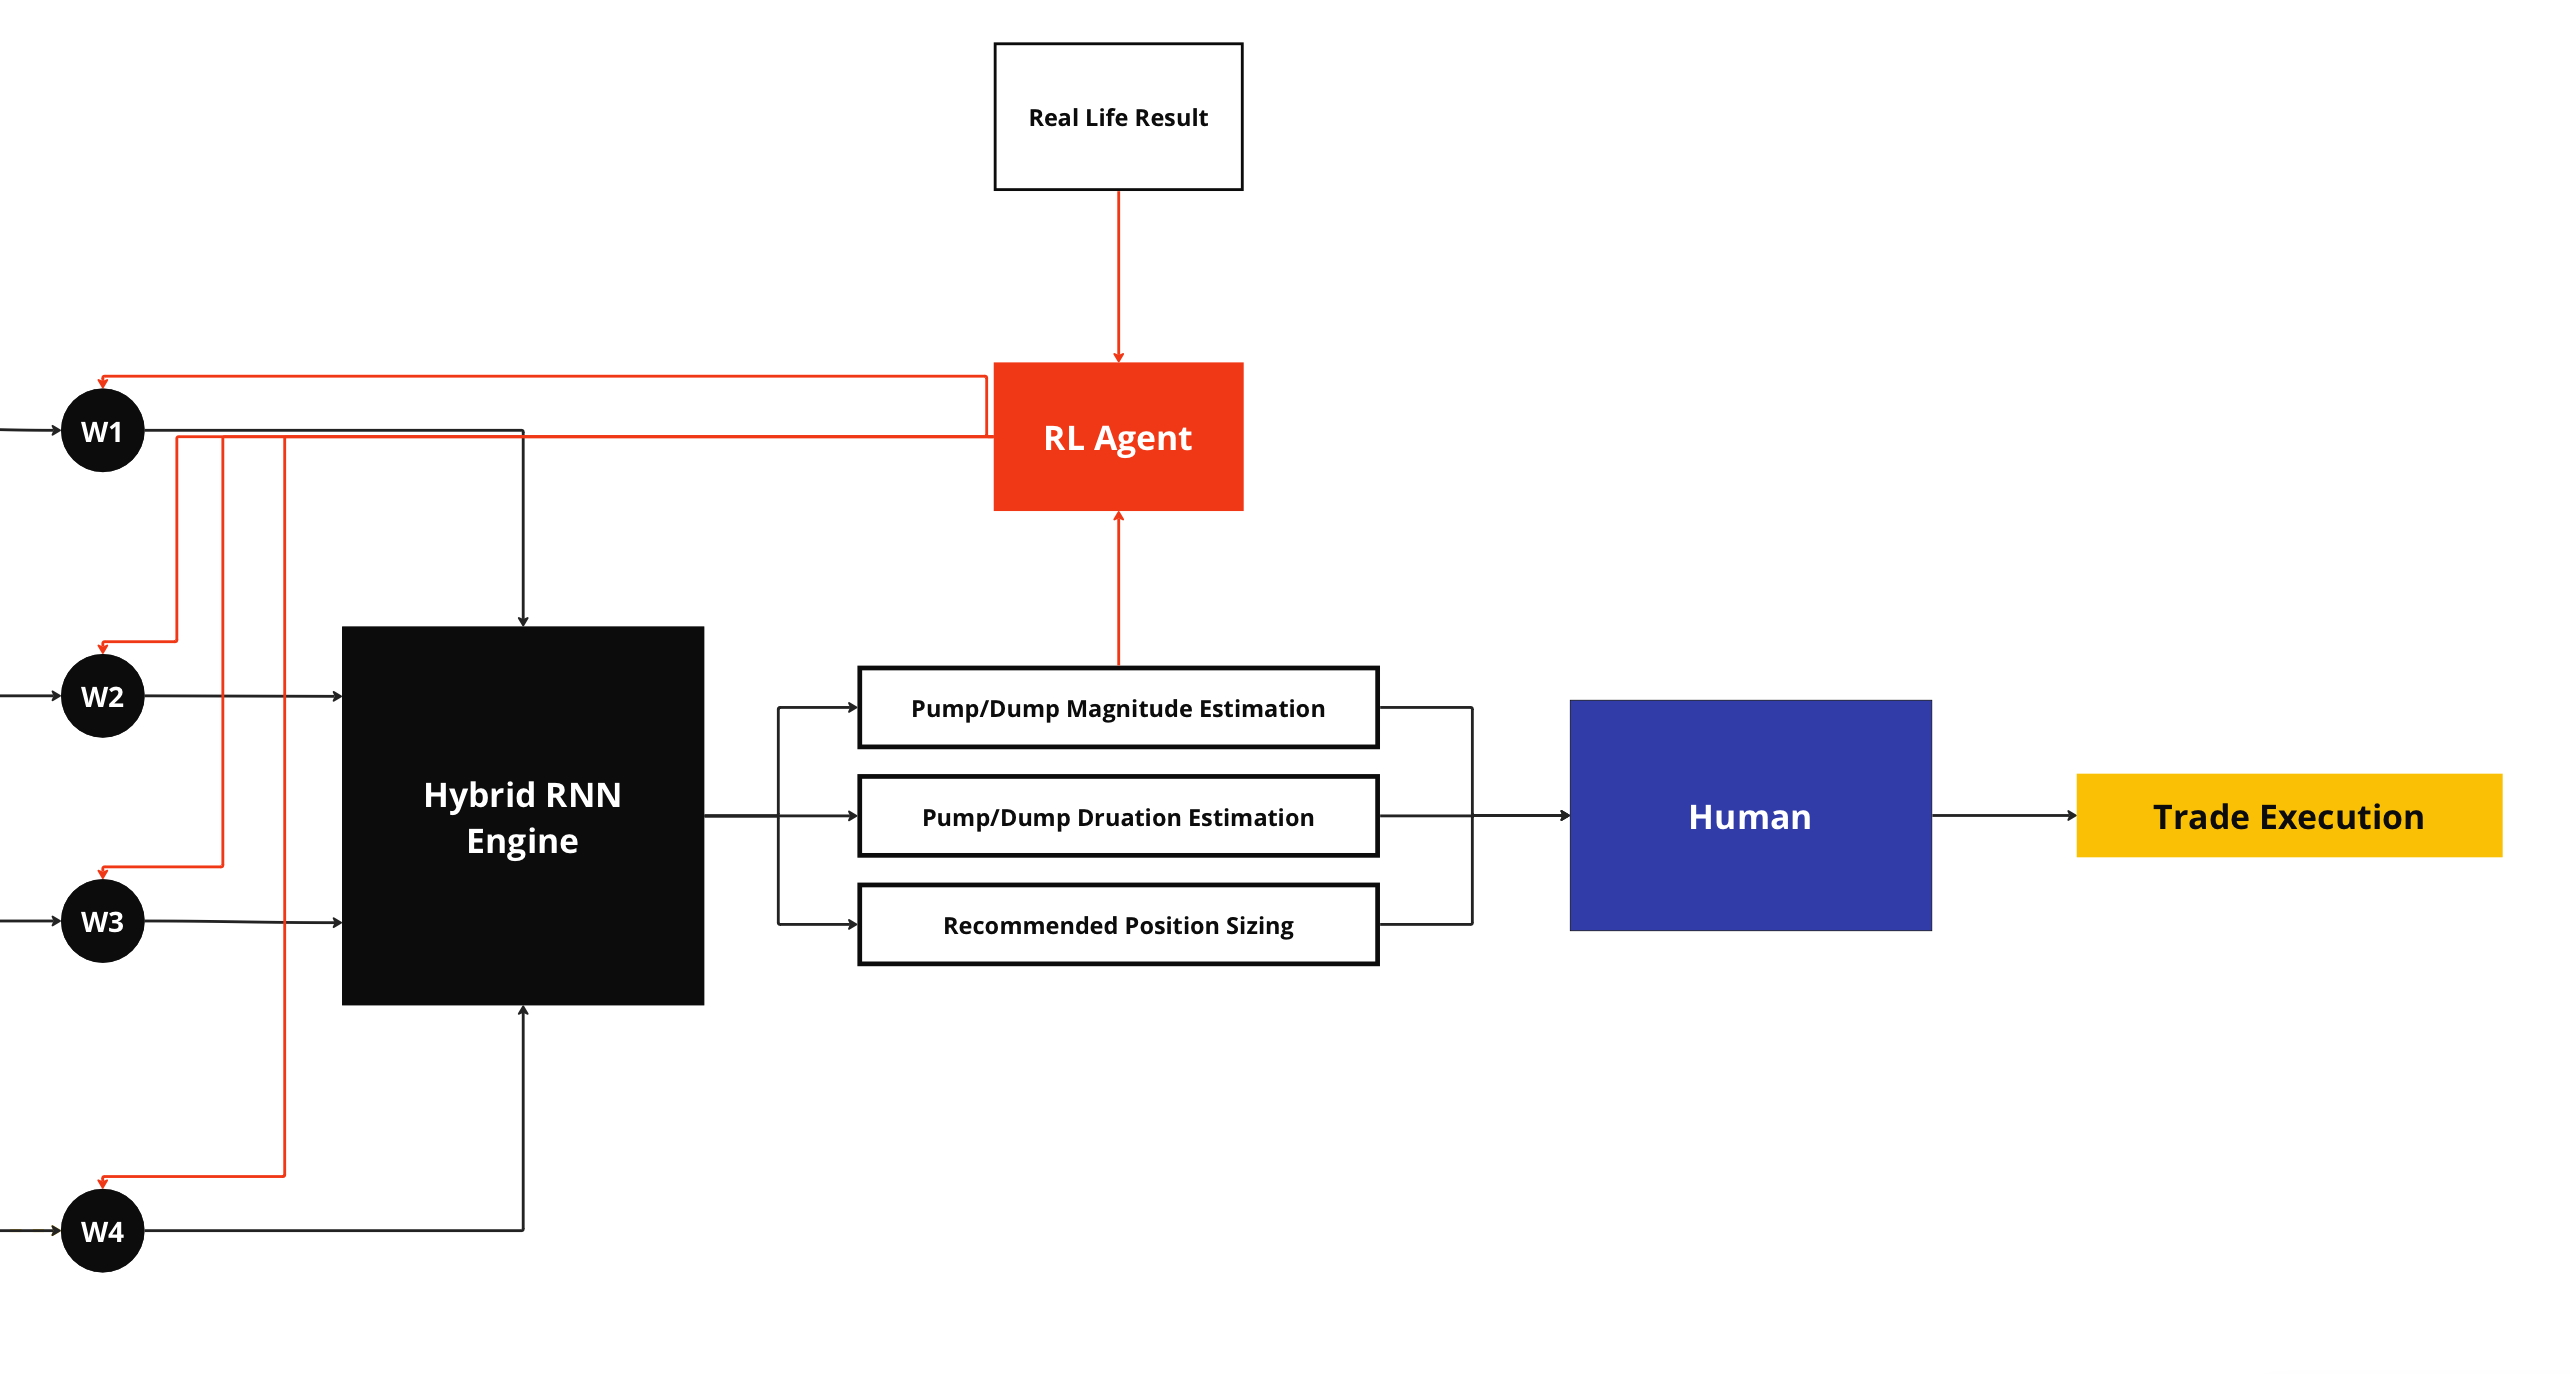
To maintain and continuously improve robustness and precision, we've seamlessly integrated a Reinforcement Learning Agent. This agent bridges the gap between the RNN Engine's outputs and the initial weights assigned to each sector (W1, W2, W3, W4). Its primary role is to monitor discrepancies between the RNN Engine's forecasts and real-world results, enabling real-time fine-tuning of the RNN Engine and timely adjustments to the weights.
Now, let’s see how the model can benefit a trader or any trading algorithm to help them measure the market’s reserved risk simultaneously, improving their performance and helping them make more accurate decisions.
As an illustration, we will opt for a straightforward trading strategy employing the Moving Average Convergence Divergence (MACD) indicator to exclusively generate sell signals. This strategy will be assessed over a five-year span, encompassing historical daily price data for Bitcoin from March 2018 to September 2023. Our aim is to enhance its efficacy through the utilization of our model as an observer of the signals generated by the strategy. We commence with an initial capital of $1,000 and implement a policy that restricts the strategy from allocating more than 50% of its capital to any single trade.
Fast Length: 12
Slow Length: 26
MACD Length: 9
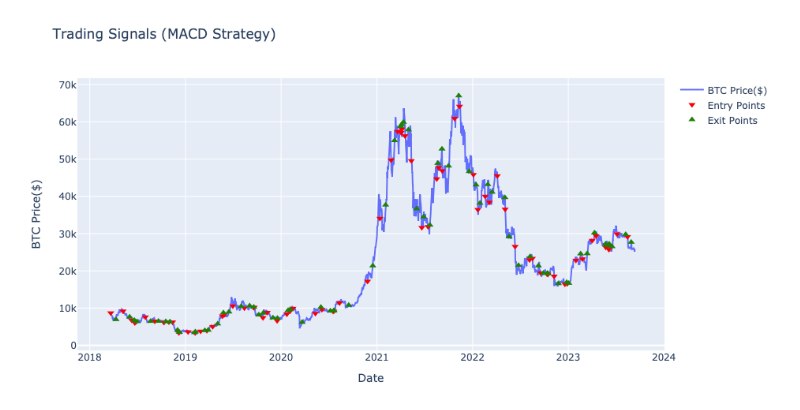
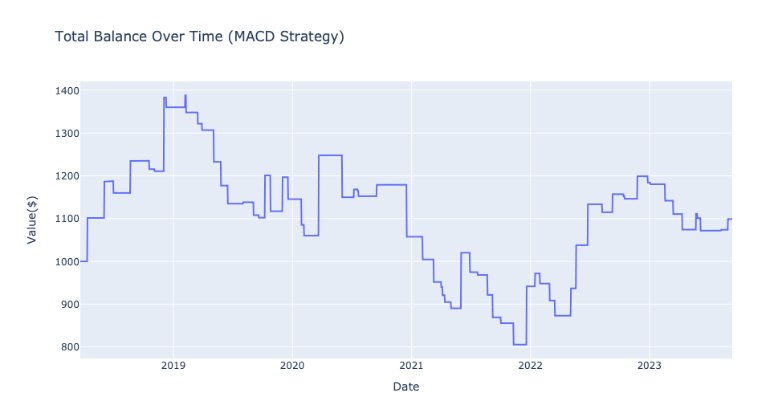
{'Total ROI (%)': 9.90939133473705,
'Total PnL ($)': 99.09391334737052,
'Max Drawdown (%)': -41.97695365563481,
'Number of Trades': 71,
'Number of Profitable Trades': 25,
'Number of Losing Trades': 46,
'Winrate (%)': 35.2112676056338}
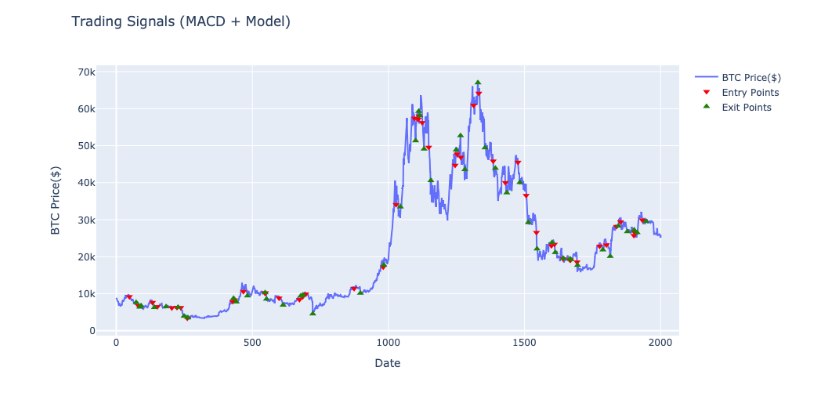
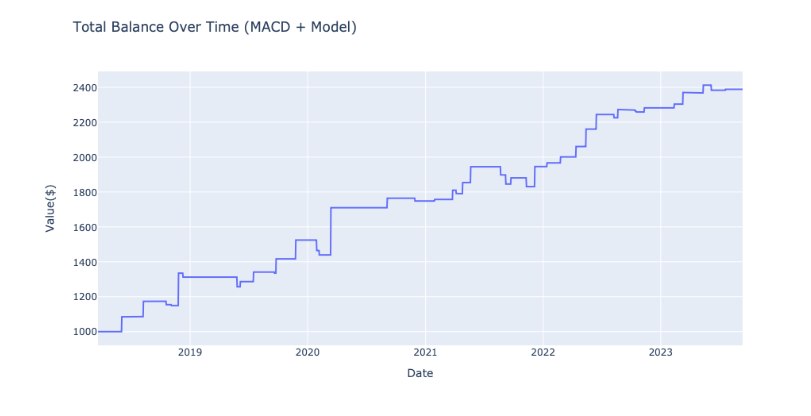
{'Total ROI (%)': 138.86165416675317,
'Total PnL ($)': 1388.6165416675317,
'Max Drawdown (%)': '-5.8498766879112',
'Number of Trades': 48,
'Number of Profitable Trades': 29,
'Number of Losing Trades': 19,
'Winrate (%)': 60.416666666666664}
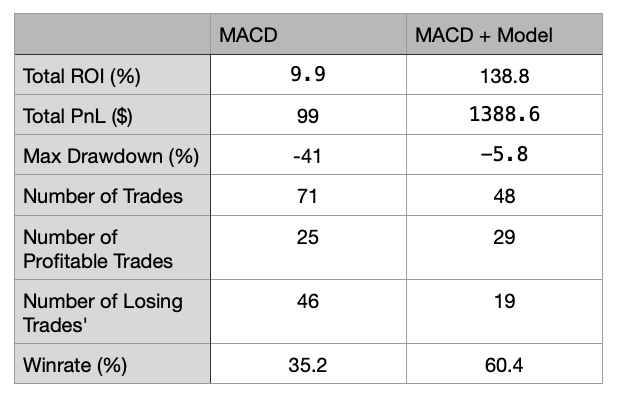
Upon examining the table above, it becomes evident that our engine has amplified the strategy’s ROI by a factor of 14X. Concurrently, there's a discernible decrement in the maximum drawdown by approximately 7X. Furthermore, there’s a contraction in the number of trades executed by nearly 30%, and the strategy's win rate has seen an enhancement by a magnitude of 1.7X.
Remarkably, these enhancements transpired without fully harnessing the model’s capabilities, such as Recommended Position Sizing or Pump/Dump Magnitude Estimation.
Instead, we capitalised on its real-time risk Measurement, establishing a threshold to sift through the generated signals and promptly conclude open positions upon the model's recognition of trend reversals. Notably, we implemented this approach solely for Short selling signals. We also did not subject the strategy to optimisation or hyperparameter tuning.
Please be aware: This involves straightforward backtesting under optimal conditions without accounting for fee reductions, funding fees, or price slippage. The strategy's backtesting on a daily interval somewhat diminishes the model’s precision, as it relies on intraday calculations to confirm its signals.
Future: Building on our foundational expertise, we have seamlessly incorporated eight AI engines dedicated to meticulously processing billions of data points. With our track record of relentless innovation, we envision the next phase encompassing comprehensive advancements to the engine. Our overarching ambition is to bolster its precision and broaden its applicability across various asset classes and market sectors.
The Deep-Alpha Fund represents Capsmark's apex in high-risk investment strategies. It's fundamentally intertwined with the cutting-edge TXFEE model, designed specifically to navigate the complex dynamics of the cryptocurrency market. Deep-Alpha's primary goal is to accurately reflect the market's trajectory during its bullish phases, targeting a Beta close to one. It's crucial for investors to understand that, unlike Capsmark’s Signature Fund, Deep-Alpha has a heightened risk profile, with potential downturns exceeding 40%. However, the fund is steadfast in its commitment to maximising profits during market surges, making it an enticing option for investors seeking substantial returns in the volatile cryptocurrency arena.
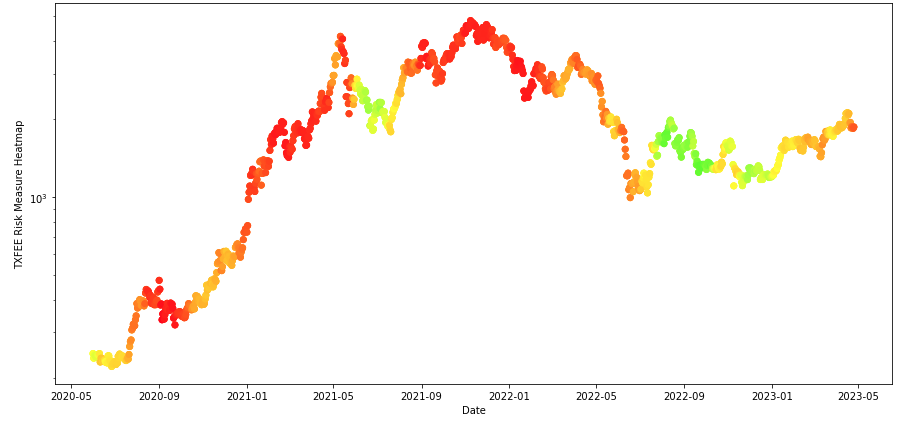
The heatmap image above represents how TXFEE sees the Ethereum price’s reserved risk over time. (Red: Higher risk, Green: Lower risk)
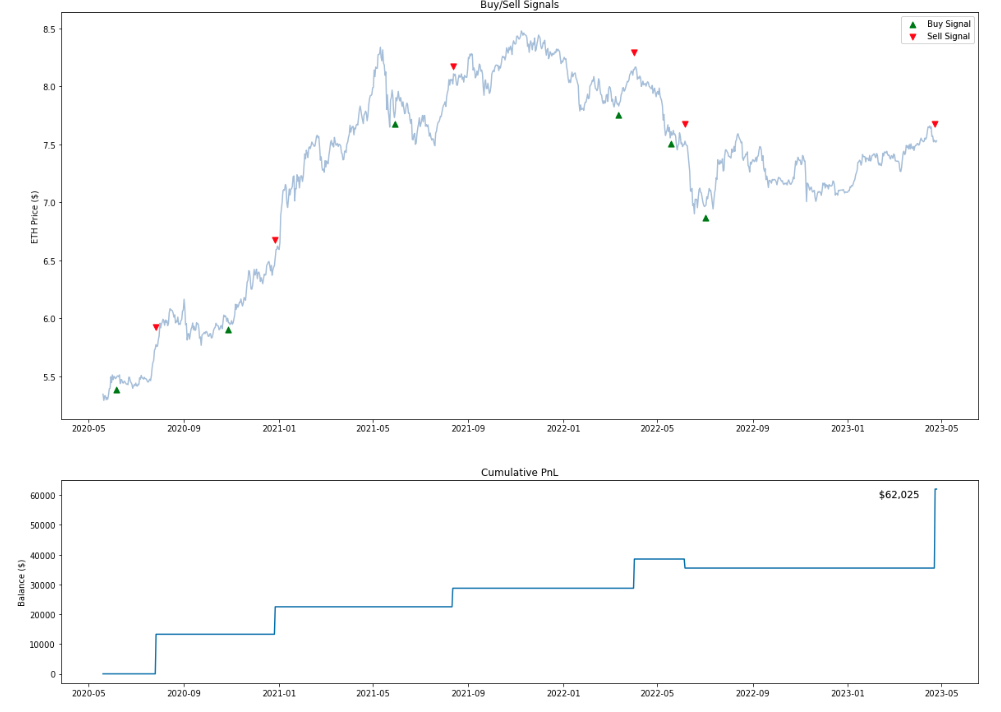
Given the TXFEE model, implementing a simple trading strategy using some RL and NN algorithms result in over 500% ROI within a 3-year interval executing only six trades.
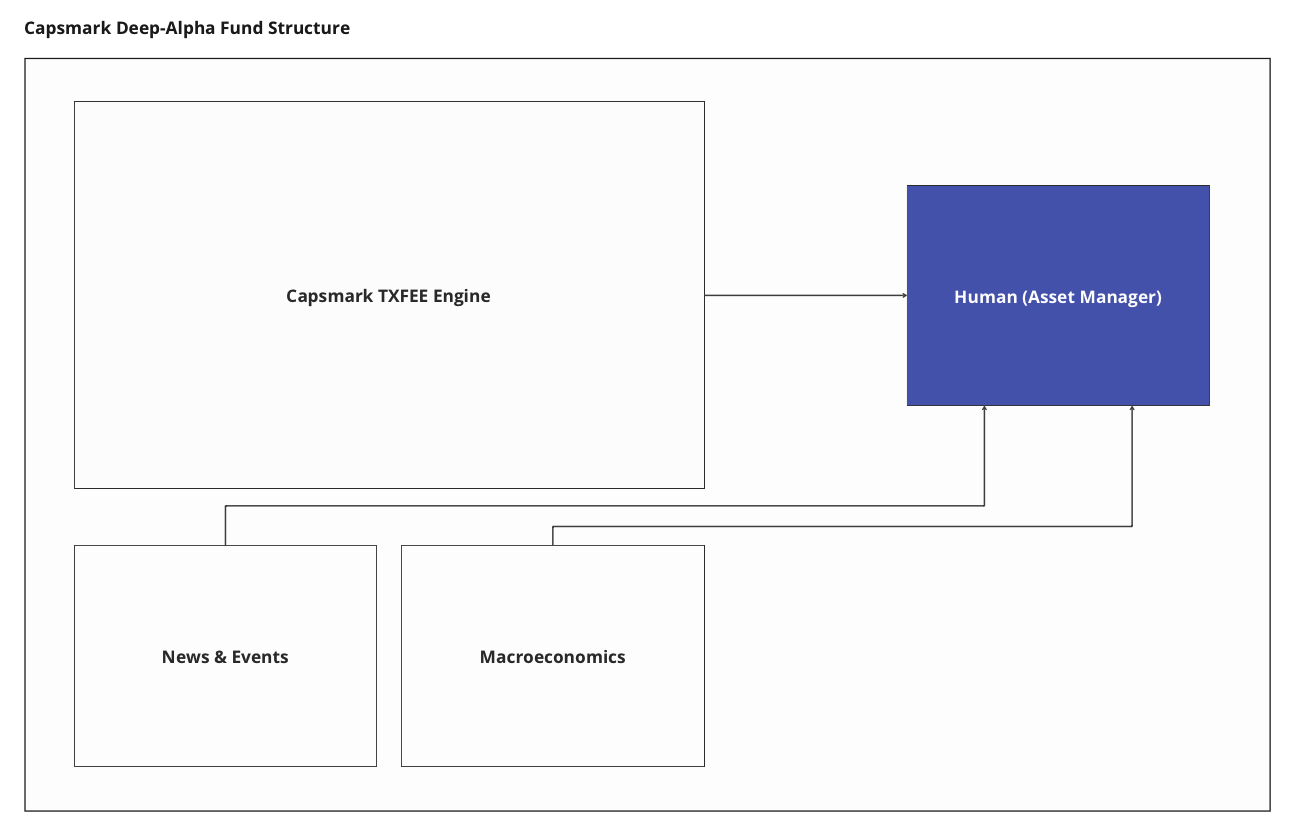
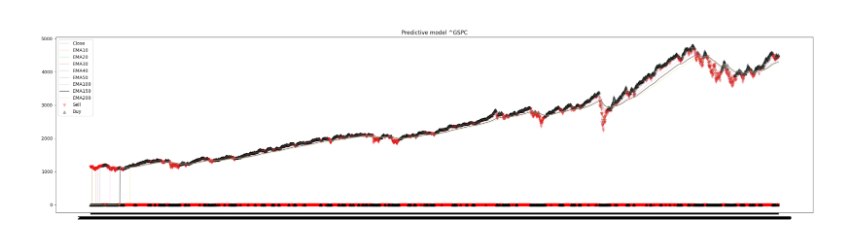
In algorithmic trading, our pioneering system represents a paradigm shift. We've designed a multi-transformer trading system that harnesses the power of mathematical descriptors, technical indicators, and deep neural networks to predict asset prices and generate trading signals.
Problem Statement:
Financial markets are characterised by volatility, complexity, and the need for timely decision-making. Our system addresses these challenges by leveraging mathematical descriptors like the Fourier and Maclaurin series alongside a rich set of technical indicators and oscillators to make informed predictions.
Objectives:
Our system is anchored by an advanced architecture. It begins with the input of mathematical describers and technical indicators into transformers. These transformers refine and augment the data, facilitating a more nuanced grasp of market trends. This enhanced data then feeds into two deep neural networks, which produce precise trading signals.
Our system hinges on premium data. We diligently source information from diverse origins, prioritising accuracy and comprehensiveness. This data is integral to our trading models, underpinning robust training and testing processes.
We use the Fourier and Maclaurin series as our mathematical describers. These tools decode complex patterns and tendencies within financial data, enabling our system to interpret intricate market shifts.
Our toolkit comprises a variety of technical indicators and oscillators. These tools offer vital perspectives on market trajectories, volatility, and prospective opportunities.
Transformers in data preprocessing refine raw data for machine learning. They filter noise, enhance information, and create optimised features, ensuring the models receive data in its best form for accurate predictions.
At the core of our system are the deep neural network decision-makers, which are sophisticated machine learning models. Once they receive the transformed and optimized data, these networks delve deep into the data's intricacies to detect patterns, trends, and anomalies. Through rigorous analysis and learning, they swiftly produce trading signals. Essentially, these decision-makers act as the bridge between raw, data-driven insights and actionable, profitable trading decisions, ensuring our strategies are informed and effective.
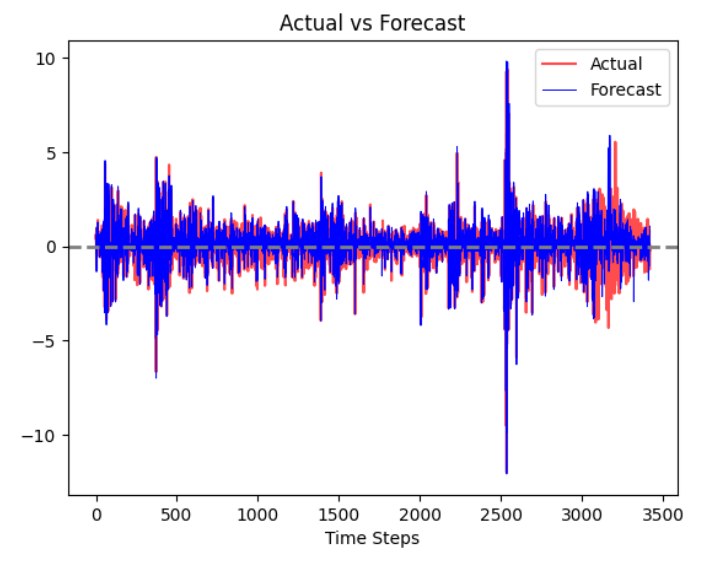
Our system undergoes rigorous training and testing phases to ensure robustness and reliability. These processes validate its performance in real-world trading scenarios.
In testing, our system exhibited exceptional performance, securing a profit of approximately $3,600 within the scope of the S&P 500. This is notable, especially when juxtaposed against daily price fluctuations nearing $7,000. Core metrics such as profit, drawdown, Sharpe ratio, and alpha/beta further emphasize the system's effectiveness.
A hallmark of our system is its flexibility. It effortlessly adapts to various assets and markets, consistently yielding favourable outcomes. This adaptability positions it as a prized asset for investors and institutions aiming for a competitive advantage.
Our multi-transformer trading approach offers a fresh perspective on algorithmic trading. By combining mathematical descriptors, technical indicators, and deep neural networks, we've developed a method that navigates the changing financial landscape with adaptability and efficiency.
Our journey is an ongoing commitment to the relentless pursuit of excellence in the realm of trading. As we move forward, our roadmap is clear: refining our existing strategies to further optimize outcomes, enhancing the system's adaptability to seamlessly integrate with a broader range of assets and markets, and venturing into untapped territories within algorithmic trading. Every step we take is with an eye on innovation and elevating our benchmarks.
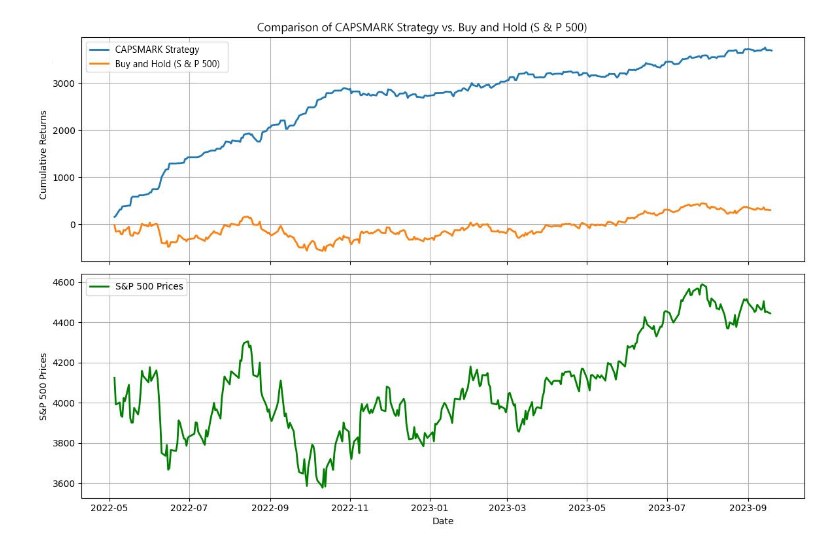
Maximum Drawdown: -0.0914196864
Sharpe Ratio: 4.396366447568421
Alpha: 10.254386591095681
Beta: 0.031041198471369467
We embarked on a project to develop a Gradient Boosting Regression model specifically tailored for forecasting the Core Consumer Price Index (CPI). Drawing from a rich database, the model is trained on an extensive collection of historical CPI data. This foundational training equips the model with a profound understanding of past trends and fluctuations. Our aim is to utilize this knowledge to make informed predictions about future CPI values. The model takes into account various relevant features, meticulously analyzing them to generate forecasts that are both precise and actionable for economic planning.
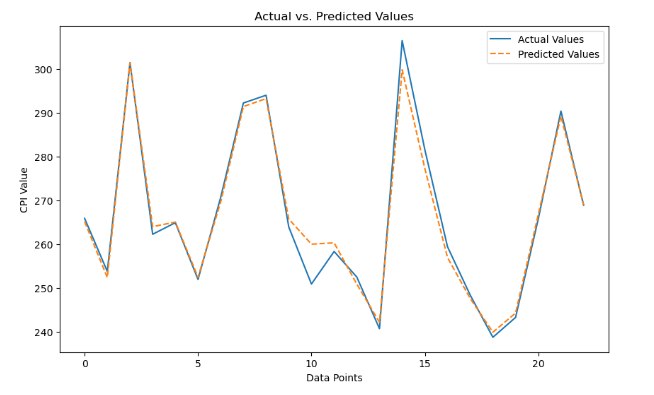
Our CPI forecasting model has consistently delivered accurate Core Consumer Price Index projections. Beyond its precision in predictions, the model also offers insightful feature importance analysis, shedding light on the key factors driving CPI fluctuations. By ranking the relevance of each feature, we obtain a clearer picture of the underlying influences on CPI changes. Over time, we've fine-tuned this model, introducing a range of additional features and subtly modifying its approach.
In this project's scope, we took the initiative to create a cutting-edge Long Short-Term Memory (LSTM) model, specifically aimed at accurately predicting and pinpointing economic recessions. LSTMs, being a subclass of recurrent neural networks, excel in tasks that require learning from sequences, making them ideal for analysing time-series data like economic indicators. Our model was rigorously trained on a comprehensive array of economic metrics. This diverse dataset ensured the model had ample opportunity to identify and learn from the intricate temporal trends and interdependencies characterising economic data. As a result, our LSTM model is well-equipped to recognise early signs of economic downturns, giving policymakers and businesses a crucial lead time for preparation and response.
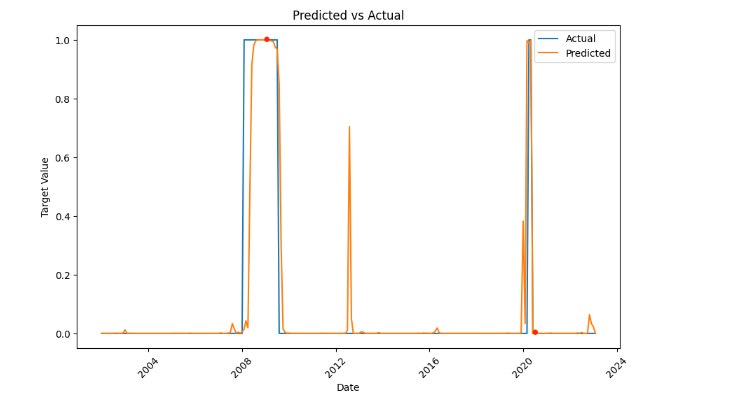
Our LSTM-based model for predicting recessions has done quite well, achieving a 98% success rate in its forecasts. It has shown better results than some other methods typically used for this purpose. By understanding the patterns in economic data, our research can offer insights into how economies change over time, helping decision-makers plan better.
It's important to mention we've made some updates to the model, adding new details and focusing on shorter prediction periods to make sure our forecasts remain accurate.
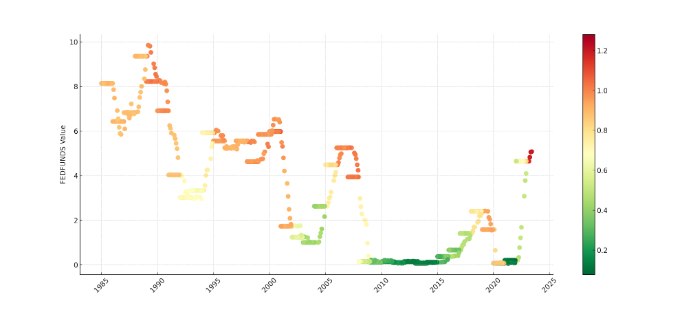
This index is a transparent and easily comprehensible tool for assessing the degree of risk linked to the Federal Reserve's interest rates. It achieves this by considering and analysing a range of treasury rates widely regarded as critical indicators within the financial market landscape.
To provide a bit more context, the Federal Reserve's interest rates play a pivotal role in the broader economy. These rates are the foundation upon which borrowing and lending costs are determined, influencing various facets of financial markets, from mortgage rates to corporate borrowing costs.
Now, as we delve deeper into the mechanics of this index, its colour-coded scale becomes particularly valuable. Moving towards the "red" end of the spectrum within this index is akin to sounding an alarm. It signifies an increasing level of concern and risk in relation to potential future Federal Reserve rate hikes.
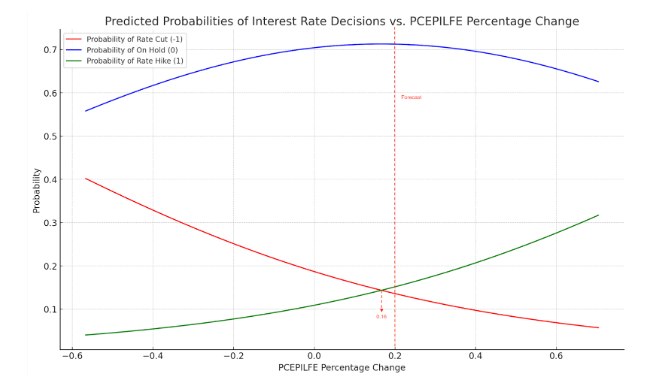
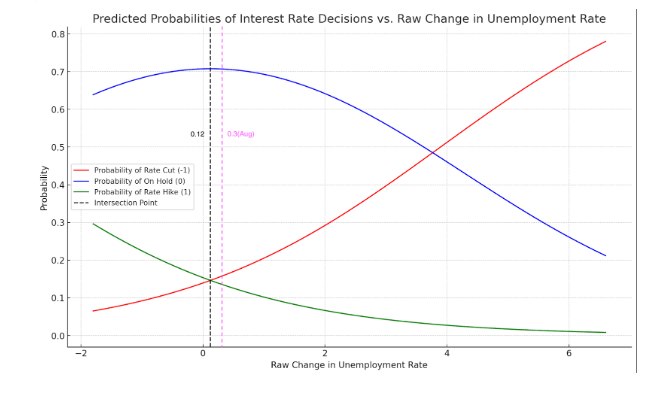
Our polynomial logistic regression model examines the influence of econometric factors on Federal Reserve interest rate decisions. By analysing historical data and the interplay of economic indicators, we aim to uncover patterns that can help us understand how econometric changes impact the Federal Reserve's interest rate policy choices. This model is valuable for providing insights into the drivers behind monetary policy decisions and their potential implications for the economy, financial markets, and various stakeholders.
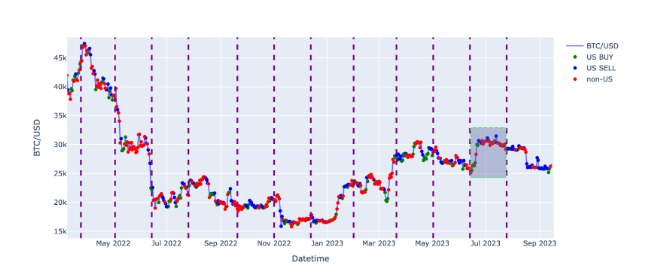
Our advanced statistical model, utilising the Coinbase Premium Index, has been meticulously developed to track Bitcoin price movements within the United States. Analysing historical data and employing cutting-edge statistical techniques can pinpoint fluctuations in U.S. Bitcoin prices compared to the global market. This model offers valuable insights to investors, regulators, and researchers, enhancing their ability to make informed decisions and understand the cryptocurrency market dynamics.
Our forward-looking strategy encompasses several dimensions:
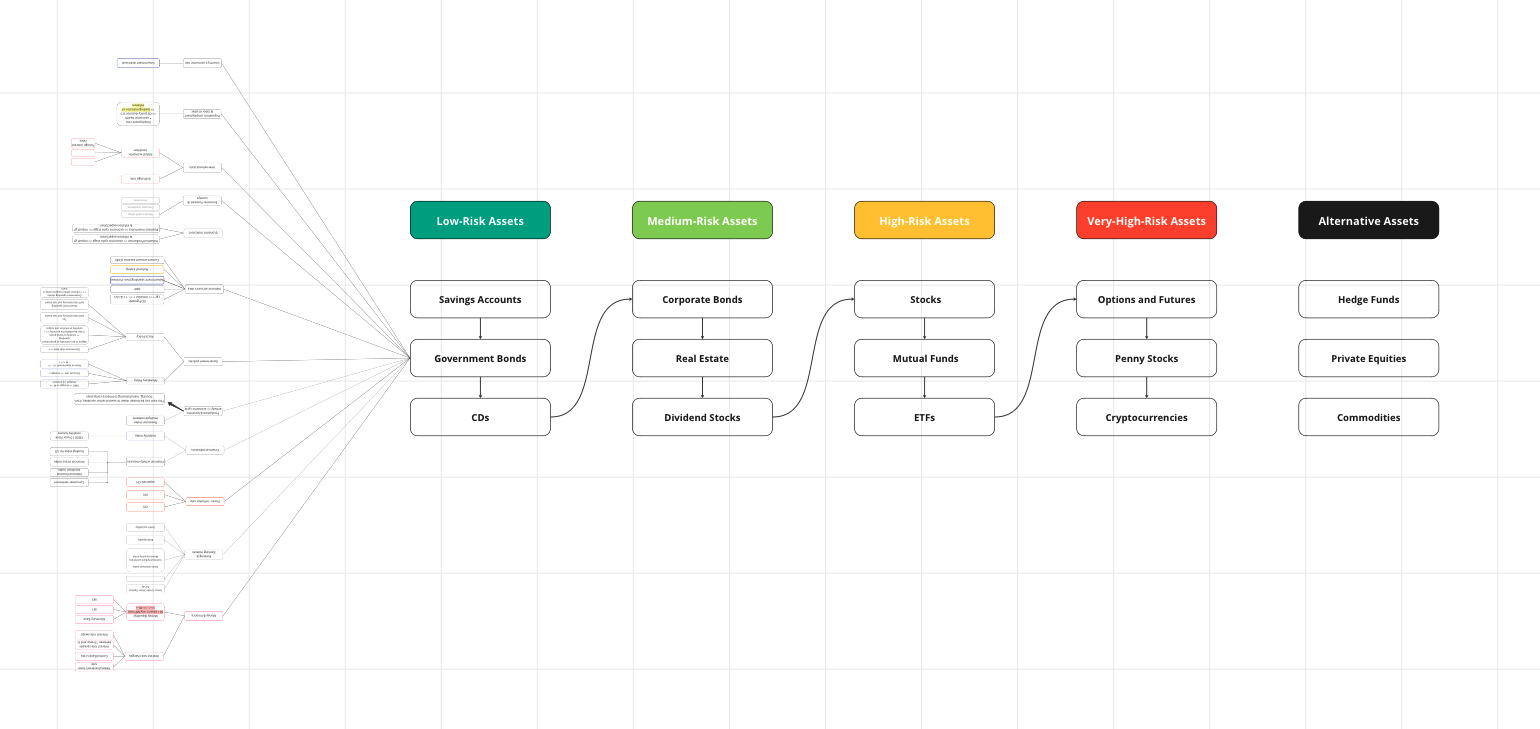
To achieve our goals, we have initiated the integration of data-intensive Foundation models across the entire economy over the coming years. Our approach commenced with categorizing each asset class based on their inherent risk profiles. We aim to systematically model these assets, ranging from Low-Risk to Very-High-Risk categories, using a consistent methodology that includes:
1. Identifying and documenting key influencing factors.
2. Comprehensive data collection.
3. Rigorous modeling processes.
As illustrated in the accompanying image, our current focus is on Government Bonds and Savings Accounts. We are optimistic that this sector will be fully modeled within the next three months, aligning with our established roadmaps.
This blueprint reflects our ambitions and our unwavering dedication to innovation and excellence.